Service discovery: how 500 services find each other
Service discovery in depth: registries, heartbeats, TTLs and leases, client caching, the stale-window formula, and what a faster TTL costs in heartbeat traffic.
In this lesson you will learn
- Why a dead instance keeps getting traffic for about TTL + propagation + client cache seconds, and how to compute that window
- Why a shorter TTL needs more heartbeats (rate = instances / interval) and more false removals under GC pauses
- How Consul, etcd, Eureka and Kubernetes implement registration, expiry and change propagation, and how each behaves in a partition
Builds on Lesson 19: Monolith vs microservices 18 min read Next: SQL vs NoSQL
Drafted with AI assistance, then checked and edited by a human engineer · How we write
Short answer
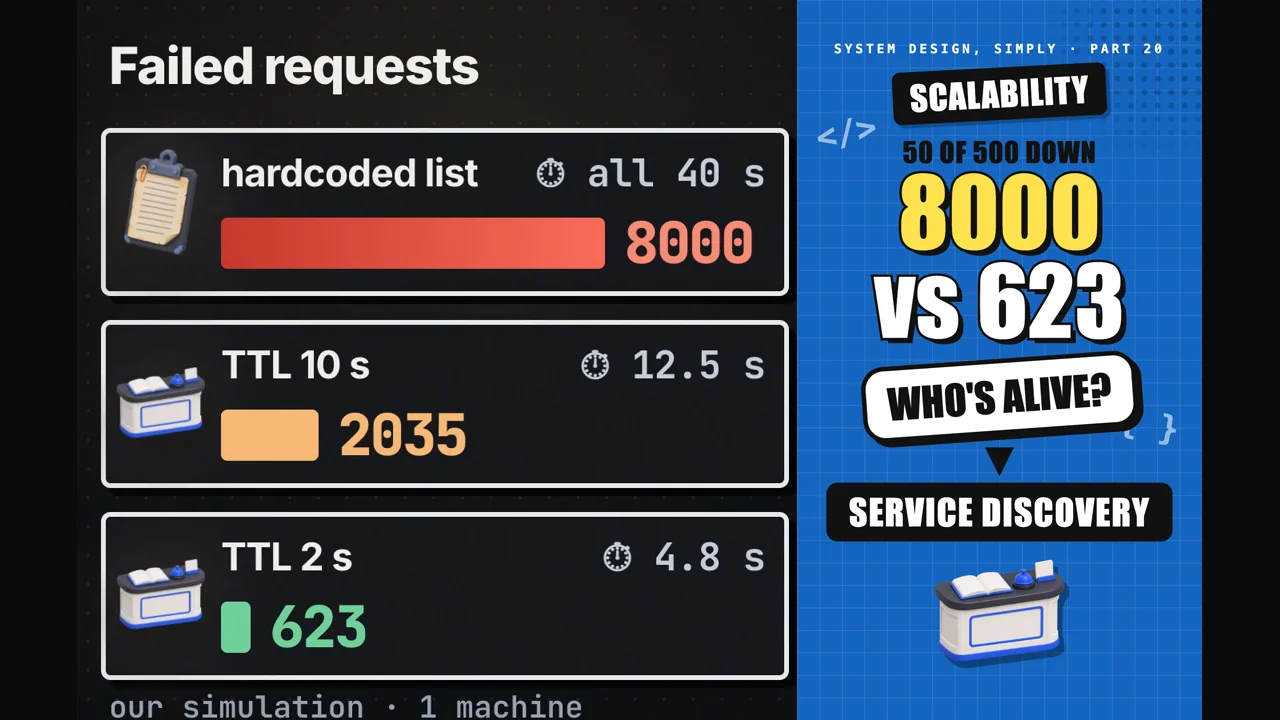
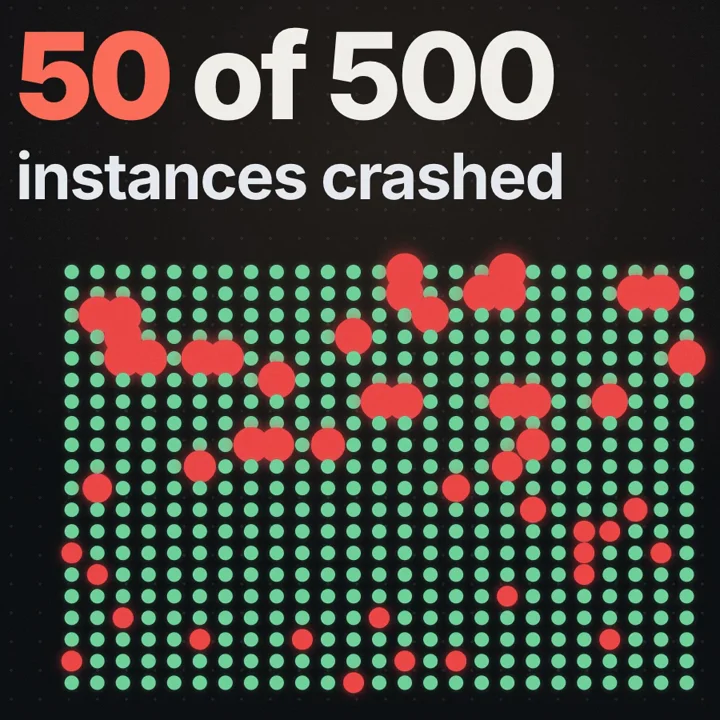
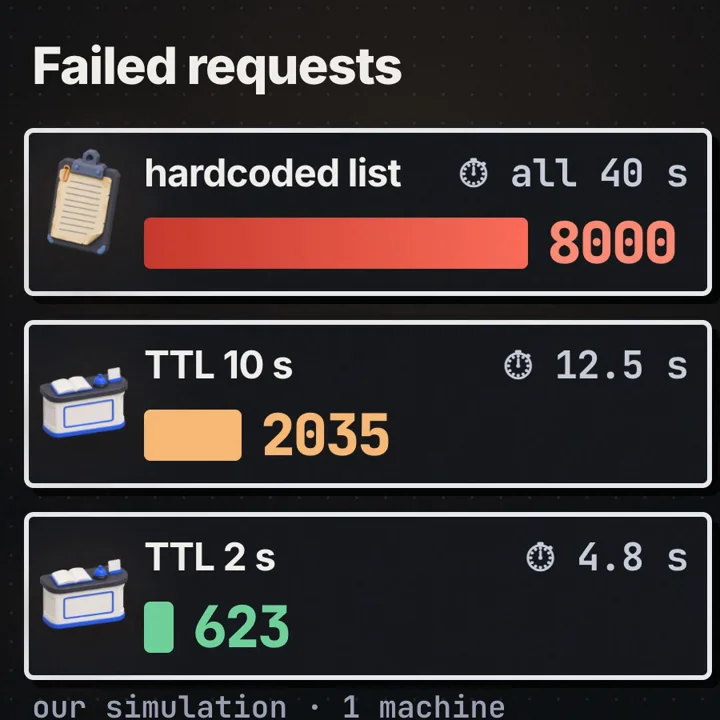
Callers find live instances through a registry: instances heartbeat in, silent ones expire after a TTL, callers cache the list. Dead instances still get traffic for about TTL + propagation + cache. In our one-machine simulation, 50 of 500 died: a hardcoded list failed 8000 requests, a 10 s TTL 2035 (12.5 s stale), a 2 s TTL 623 (4.8 s), at about 5x the heartbeats (924/s vs 186.2/s).
| Hardcoded list | With 50 of 500 instances dead from t = 20 s, a fixed address list failed 8000 requests, 2000 req/s x 10% x 40 s, and was still failing at the end of the 60 s run |
|---|---|
| Registry, 10 s TTL | Heartbeat every 2.5 s, callers cache 3 s: 2035 failed requests, last one 12.5 s after the crash |
| Registry, 2 s TTL | Heartbeat every 0.5 s, callers cache 3 s: 623 failed requests, last one 4.8 s after the crash |
| Cost of the faster TTL | Heartbeats to the registry rose from 186.2 to 924 per second, about 5x, because the interval was 5x shorter; registry lookups stayed at 6.7 per second in both |
| Stale window formula | Time a dead instance keeps getting traffic is about detection (up to the TTL) + propagation + client cache; worst case 10 + 3 = 13 s and 2 + 3 = 5 s in our lab |
| Lookup cost | Registry query 0.0157 ms of CPU (measured, in-process); round trip 0.7022 ms (assumed, not measured); refreshes run in the background |
| Setup | Our virtual-clock simulation on one machine (labs/sd-20), seed 20: 500 instances, 50 killed at 20 s, 20 callers x 100 req/s, 60 s, no retries. Not a benchmark |
In a system with hundreds of service instances, addresses change all the time: instances crash, scale in and out, and move between machines, so a caller cannot rely on a list written into its config. Service discovery keeps a live list of healthy instances in a registry and gets it to callers, and every design choice in it trades how quickly a dead instance stops getting traffic against how much heartbeat and lookup traffic you pay for. The question for this part: when 50 of 500 instances die, how long do callers keep sending them requests, and what does it cost to make that window shorter?
Prerequisites
Why there are so many instances. Part 19, monolith vs microservices, split one app into services; scaling each out makes every service a pool of instances behind one name, with addresses that change on every reschedule. The caller wants "a healthy orders instance", not a particular machine.
Load balancing picks one; discovery says who is eligible. Load balancing algorithms choose among a list of backends. Discovery produces that list, and a perfect algorithm over a stale list still sends requests to dead addresses.
DNS and caching. DNS maps a name to addresses and every layer caches the answer for its TTL, as covered in what happens when you type google.com. Service discovery has the same shape with much faster change, so cache settings decide most of the behaviour.
Definitions
Service registry: a database of the network locations of service instances, with each entry's health, that callers or proxies query to find where to send a request.
Registration: adding an instance to the registry. In self-registration the instance registers itself; in third-party registration a separate component (an agent, an orchestrator, a controller) registers and removes it.
Heartbeat: a small periodic message from an instance (or its agent) to the registry that says "still alive". The time between two heartbeats is the heartbeat interval.
TTL (time to live) and lease: the longest an entry stays valid without being renewed. A lease is a TTL the registry grants as an object: keys attached to it are deleted when it expires unless the holder keeps it alive.
Active health check: a check in which the registry or an agent probes the instance (an HTTP GET, a TCP connect, a gRPC health call) rather than waiting for the instance to report in.
Client-side cache: the caller's local copy of the registry's answer, reused until it expires or a watch delivers a change, so most requests need no registry call.
Stale window: the time from an instance dying to the last request any caller sends it. In our lab it is measured from the crash to the last failed request.
How does service discovery work?
Every discovery system has the same four moving parts: registration (an instance appears in the registry), health (the registry decides the instance is still good), propagation (a change in the registry reaches callers) and selection (a caller or proxy picks an instance from what it knows). The designs differ in who does each part.
Client-side vs server-side discovery
In the client-side discovery pattern, the caller queries the registry, caches the answer and picks an instance itself, then calls it with no extra hop. The cost is a discovery-aware client in every language you run, and every caller's cache is one more copy that can be stale.
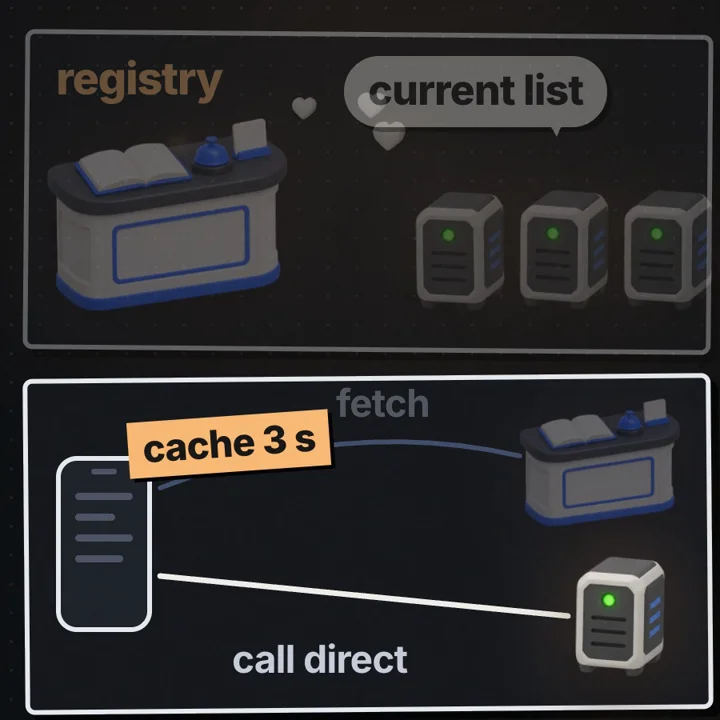
In server-side discovery the caller sends every request to one stable address (a load balancer, a proxy or a virtual IP) that reads the registry and forwards it. A Kubernetes Service is this pattern: the caller connects to the ClusterIP, and kube-proxy has programmed each node's packet rules (iptables, IPVS or nftables) to send it to a ready pod. Callers need no library, but a component in the path must itself be highly available. A service mesh mixes the two: a sidecar proxy beside every caller does client-side discovery on its behalf.
Self-registration vs third-party registration
With self-registration the instance registers on startup, renews while running and deregisters on shutdown, as Eureka clients do. A crash skips the deregistration, so expiry is what removes crashed instances. With third-party registration something else updates the registry: in Kubernetes the EndpointSlice controller marks a pod ready or not ready from its readiness probe, and the application never talks to the registry. A Consul agent on each node sits in between: the service registers with its local agent, which runs the checks and syncs results to the servers.
Heartbeats vs active health checks
A heartbeat is pushed by the instance; an active check is pulled by an agent or the registry. A heartbeat proves the process can send a message, not that it can serve: an instance with every request thread blocked can keep heartbeating from a background thread. An HTTP check through the real request path catches that. Consul supports both: TTL checks wait for the application to report pass, warn or fail, and HTTP, TCP, gRPC and script checks run on the agent at a fixed interval. Because the agent checks over loopback, a failure means the service failed, not the network. A central registry waiting for heartbeats across the network cannot tell "instance dead" from "path broken", which is the root of the partition problems below.
How long does a dead instance keep getting traffic?
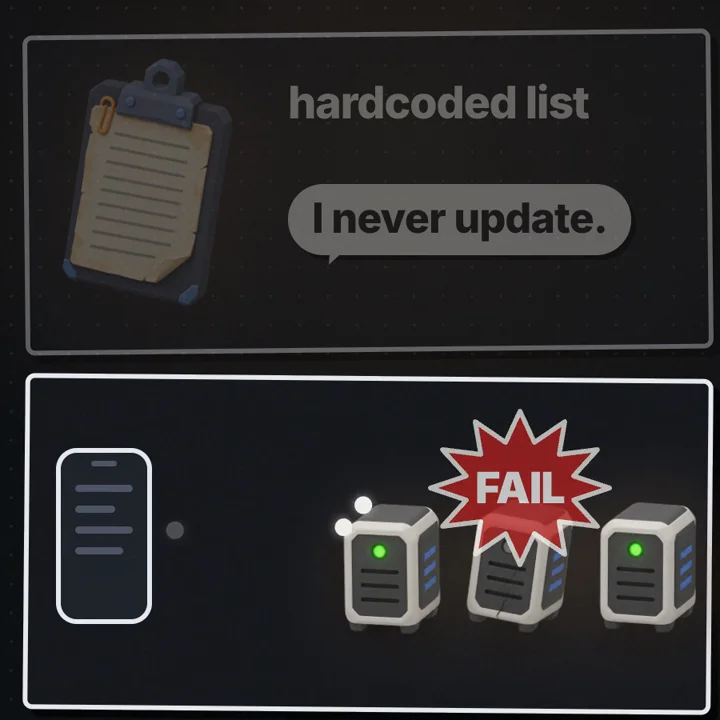
With a hardcoded list the stale window is "until a human or a deploy changes the config". With a registry it has three parts that add up:
stale window  ≈  D + P + C

D  detection     time from the crash until the registry marks the instance gone
                 heartbeat + TTL:  D = TTL - a, where a = age of the last heartbeat
                 at the crash (0 <= a <= one heartbeat interval), so D <= TTL
                 active check:     D ≈ interval x failures needed (+ check timeout)
P  propagation   registry replication + time for callers to learn (watch delivery,
                 or a poll's round trip)
C  client cache  0 to the cache length, depending on when the caller last refreshed
worst case    ≈  TTL + P + cache length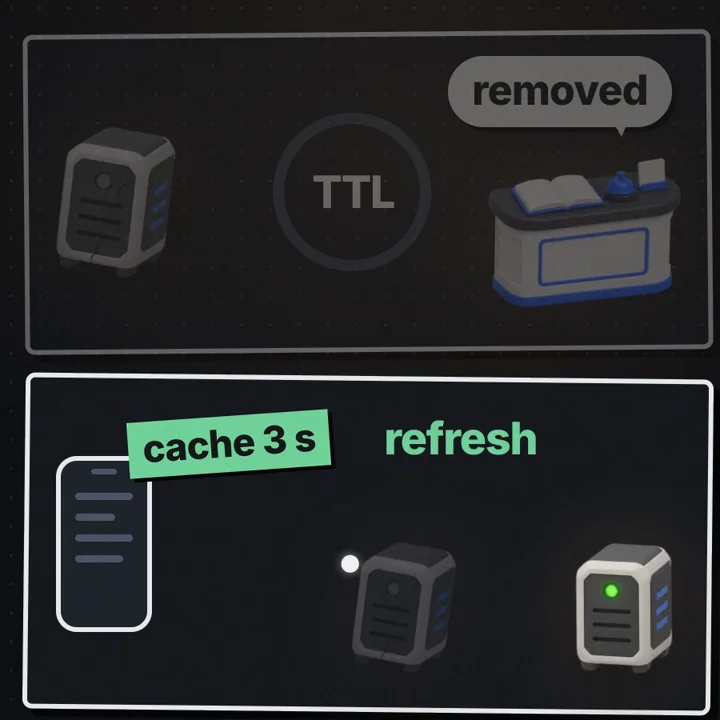
The heartbeat phase is subtracted: an instance that heartbeated just before dying is removed almost a full TTL later, one that was nearly due is removed about one interval sooner. Re-running the lab's (labs/sd-20) heartbeat schedule shows the 50 dead instances' last heartbeats were 0.14 to 2.71 s old at the crash in the 10 s TTL setup, and 0.01 to 0.51 s old in the 2 s setup. The last one removed in the 10 s setup was dropped about 9.86 s after the crash, and the slowest caller's cache added up to 3 s more. The lab's propagation is one 10 ms tick on purpose (one in-process registry, an assumed 0.7022 ms round trip, no replication). Results against the bound:
setup              worst case D + C        lab stale window
TTL 10 s, cache 3  10 + 3 = 13 s (+1 tick)   12.5 s
TTL  2 s, cache 3   2 + 3 =  5 s (+1 tick)    4.8 s
hardcoded list     no D, no C: until the end  40 s (still failing at end of run)
Two conclusions. The cache can dominate: with a 2 s TTL the 3 s cache is more than half the worst case, so cutting the TTL further buys little until the cache shrinks or becomes a watch. And real propagation is not one tick: registry replication, watch reconnects, proxy config rebuilds and kube-proxy rule updates all add to P, so measure it.
Watch vs poll
The lab's callers poll the full list every 3 s: a constant 20 / 3 s = 6.7 lookups per second in both registry setups, and up to 3 s of staleness from the cache alone. A watch removes C: the caller holds a request open and the registry answers when something changes. Consul's blocking queries take the last X-Consul-Index seen plus a wait (default 5 minutes, limited to 10) and return as soon as the index moves. etcd streams every change to a key range from a given revision; Kubernetes clients list once, then watch from the returned resourceVersion.
Watches cost fan-out: 2,000 callers watching one service receive 2,000 updates per change, and a rolling deploy is hundreds of changes. If each update is the whole list, that is the problem Kubernetes EndpointSlices were introduced to cut, by splitting a Service's endpoints into slices of at most 100 by default (configurable up to 1,000) so one pod's change rewrites one slice. A watcher that reconnects after the registry compacted its history (etcd does) must re-list everything.
What does a shorter TTL cost?
The TTL cannot be shorter than the heartbeat interval, and in practice it is several intervals so one lost heartbeat does not remove a healthy instance. Both lab setups use the same ratio, TTL = 4 intervals (10 / 2.5 and 2 / 0.5), so they tolerate the same number of missed heartbeats; only the clock speed differs. The cost is linear:
heartbeat rate  =  live instances / heartbeat interval

lab, time-averaged live instances = (500 x 20 s + 450 x 40 s) / 60 s = 28,000 / 60 = 466.7
ideal           466.7 / 2.5 s = 186.7/s        466.7 / 0.5 s = 933.3/s
lab measured    186.2/s                        924/s              ratio 924 / 186.2 = 4.96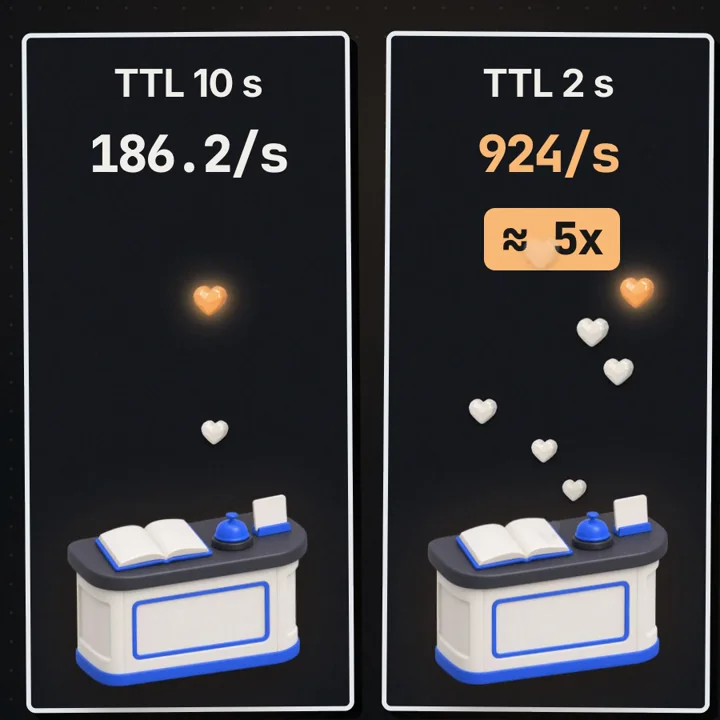
Why the lab is about 1% under the ideal: it checks heartbeats on 10 ms ticks. A heartbeat due at 507.3 ms goes out at the 510 ms tick and the next is scheduled from there, so each interval gains half a tick, 5 ms, on average. Re-running the lab's schedule gives mean intervals of 505.11 ms and 2,504.94 ms; 466.7 / 0.505 = 924.1 and 466.7 / 2.505 = 186.3, matching the measured 924 and 186.2. The 5 ms is 1% of 500 ms but 0.2% of 2,500 ms, so the ratio is 2,505 / 505 = 4.96, not exactly 5. By phase, the 2 s setup sent 989.2 per second with all 500 alive and 891.4 after the crash.
924 small messages per second is little for one server, and the lab counted messages, not registry load. The point is the slope: 20,000 instances at a 0.5 s interval is 40,000 writes per second just to learn that nothing changed, and on a consensus store renewals go through the leader.
The second cost is false removal: a healthy instance silent for a full TTL is removed. Independent packet loss rarely does it: with an assumed 1% loss and 4 heartbeats per TTL, losing all 4 has probability 0.014 = 10-8 (jitter makes it 3 in some windows, still 10-6). Correlated silence does. A stop-the-world garbage collection pause stops every heartbeat: with a 2 s TTL and 0.5 s interval, a pause of about 1.5 s can cross the TTL, while the 10 s TTL survives pauses of 7 s or more. CPU throttling under a cgroup limit or a saturated network interface do the same. Removing many at once shifts their traffic to the survivors, which may then overload and miss heartbeats too. Usually the better first move is not a shorter TTL: a watch removes C, and client-side ejection cuts the failures inside the window without touching the registry.
How do Consul, etcd, Eureka and Kubernetes do it?
These are the documented behaviours of each system; check your version's docs before relying on defaults.
Consul. Checks run on each node's agent and results reach the servers through anti-entropy syncs; the servers keep the catalog in a Raft-replicated store. A critical check drops the instance from /v1/health/service/<name>?passing at once; deregister_critical_service_after removes it from the catalog after it has been critical that long (the API docs note a 1 minute minimum and a reaper that runs every 30 seconds). Consul's DNS interface answers with a 0 TTL by default so downstream caches do not hold stale answers.
etcd. A key-value store becomes a registry through the Lease API: grant a lease with a TTL, write the instance's key with it, send keep-alives. When they stop, the lease expires and every attached key is deleted, which watchers on the prefix see as a delete event. Expiry is an ordinary replicated write.
Eureka. Per the Eureka wiki, clients renew every 30 seconds, the server removes an instance after 90 seconds without a renewal, and clients fetch registry deltas every 30 seconds into a local cache, so changes may take up to 2 minutes to reach all clients. With self-preservation, when renewals fall below a threshold of those expected (85% by default) the server stops expiring instances, treating mass silence as a network problem rather than mass death. In the formula that is up to 90 s of D plus up to 2 minutes of P, which is why Eureka clients lean on retries to another instance.
Kubernetes. Discovery is third-party and probe-driven. The kubelet runs each pod's readiness probe (defaults: every 10 s, 3 failures, so about 30 s of D); the EndpointSlice controller writes ready, serving and terminating conditions into the Service's EndpointSlices; kube-proxy watches them and updates the rules behind the ClusterIP, which is what cluster DNS returns. A dead node cannot report, so detection waits for the node controller's grace period. A headless Service (clusterIP: None) returns pod IPs in DNS, which puts client DNS caching back in the window.
DNS-based discovery. DNS works with every client and SRV records carry ports, but the TTL you set is a request. Local caching daemons and runtimes may cache longer (the JDK's networkaddress.cache.ttl defaults depend on its security configuration), and connection pools, keep-alive and gRPC channels resolve once and keep the old address until the connection breaks. Set a short TTL, cap connection lifetime, and re-resolve on connection failure.
What happens to the registry during a network partition?
A registry is a distributed system, so it has to choose, as in the cable-to-Asia partition, between answering with possibly stale data and refusing to answer.
CP registries (etcd, ZooKeeper, the Consul servers' catalog) accept writes only with a quorum. On the minority side there is no leader: registrations, deregistrations and lease expiries stop, and linearizable reads fail. Consul's stale read mode lets any server answer from its local copy, so the minority side can still serve the last known list. Nothing is removed there by mistake, and nothing is removed at all until the partition heals.
AP registries (Eureka by design) keep answering on both sides and replicate between peers asynchronously. Self-preservation guards against the worst partition behaviour: expiring many instances the registry cannot hear but callers can still reach.
The data plane can fail static too. kube-proxy keeps its last rules if it loses the API server, and Envoy keeps its last endpoints if it loses its control plane; Envoy's panic threshold (50% by default) makes it ignore health and spread load over all hosts when too few look healthy. The rule: an unreachable registry means "use the last known list", never "use an empty list".
Worked example
The video's scenario: 50 of 500 instances crash at once. How many requests fail before callers stop using them? This is a simulation on one machine with a virtual clock, not a benchmark.
setup (labs/sd-20, seed 20, 60 s virtual run in 10 ms ticks)
  500 instances, 50 (10%) killed at t = 20 s, same 50 in every setup
  20 callers x 100 req/s = 2,000 req/s, round robin over each caller's own list
  no retries: every request routed to a dead instance counts as failed
  registry setups: callers cache the answer 3 s; heartbeats +/-10% jitter
  registry round trip ASSUMED: 0.25 ms + exponential (mean 0.5 ms), sample mean 0.7022 ms

hardcoded list   2,000 req/s x 10% dead x 40 s = 8,000      lab: 8000 failed
                 (1,000 per 5 s window, every window to the end; stale 40 s, still failing)

TTL 10 s, hb 2.5 s
  traffic per dead instance   2,000 / 500 = 4 req/s
  time in a caller's list     (10 - 1.38 mean heartbeat age) + 1.5 s mean cache wait ≈ 10.1 s
  estimate                    50 x 4 x 10.1 ≈ 2,020          lab: 2035 failed, stale 12.5 s
                              (per 5 s window: 1000, 923, 112)

TTL 2 s, hb 0.5 s
  time in a caller's list     (2 - 0.28) + 1.5 ≈ 3.2 s
  estimate                    50 x 4 x 3.2 ≈ 640             lab: 623 failed, stale 4.8 s

heartbeats       466.7 live on average / interval: 186.7 and 933.3 ideal
                 lab 186.2/s and 924/s (10 ms ticks add ~5 ms per interval); ratio 4.96, about 5x
lookups          20 callers / 3 s = 6.7/s in both registry setups
lookup cost      registry query 0.0157 ms CPU (measured, in-process)
                 + round trip 0.7022 ms (assumed) = 0.7179 ms uncached estimate
                 refreshes run in the background, so no request waits for one
The estimates land within about 1% and 3% of the lab. The gap comes from the lab's granularity: each caller visits a given instance only once per 500 requests, every 5 s, so a dead instance that stays in a list for about 3.2 s gets hit by some callers and not others, and 20 fixed cache phases are not a smooth average. The mean heartbeat ages (1.38 s and 0.28 s) come from re-running the lab's heartbeat schedule.
Code
First, the lab itself: one file, Node.js 22, no packages, no network, no files written. It ran in 0.3 s of wall time.
# from the repository root
node labs/sd-20/run.mjs
It prints failed requests per 5 s window for each setup, the totals and stale windows, the heartbeat and lookup rates, and a final RESULT {...} JSON line. Request counts, stale windows and heartbeat rates repeat exactly because the seed is fixed; the two CPU timings change slightly between runs and machines.
Second, a smaller model you can change in a minute, in Python. It keeps the lab's shape (500 instances, 50 die at 20 s, 20 callers at 100 req/s, 3 s cache) but computes each dead instance's last heartbeat directly instead of ticking all 500, and it adds one client-side mitigation: when a request fails, that caller ejects the address for a while, even across refreshes.
# discovery_lab.py: TTL expiry + client cache, standard library only (Python 3.8+)
import random

INSTANCES, DEAD, CALLERS, RATE = 500, 50, 20, 100   # 20 callers x 100 req/s
KILL_AT, RUN, TICK, CACHE = 20.0, 60.0, 0.01, 3.0    # seconds

def run(ttl, hb, eject_s=0.0, seed=7):
    rnd = random.Random(seed)
    dead = set(rnd.sample(range(INSTANCES), DEAD))
    # last heartbeat each dead instance sent before the crash (random phase, +/-10% jitter)
    last_hb = {}
    for i in dead:
        t = rnd.uniform(0, hb)
        while True:
            nxt = t + hb * rnd.uniform(0.9, 1.1)
            if nxt >= KILL_AT:
                break
            t = nxt
        last_hb[i] = t

    def lookup(now):  # the registry's answer: drop anyone silent for longer than the TTL
        return [i for i in range(INSTANCES) if i not in dead or now - last_hb[i] <= ttl]

    callers = [{"list": lookup(0.0), "rr": rnd.randrange(INSTANCES),
                "expires": rnd.uniform(0, CACHE), "bad": {}} for _ in range(CALLERS)]
    failed, last_fail, per_tick = 0, None, int(RATE * TICK)
    for step in range(int(RUN / TICK)):
        now = step * TICK
        for c in callers:
            if now >= c["expires"]:                     # cache expired: refresh,
                c["list"] = [x for x in lookup(now)      # minus addresses this caller ejected
                             if c["bad"].get(x, -1.0) < now]
                c["expires"] = now + CACHE
            for _ in range(per_tick):
                inst = c["list"][c["rr"] % len(c["list"])]
                c["rr"] += 1
                if now >= KILL_AT and inst in dead:
                    failed += 1
                    last_fail = now
                    if eject_s:                          # eject it locally for eject_s seconds
                        c["bad"][inst] = now + eject_s
                        c["list"] = [x for x in c["list"] if x != inst]
    stale = None if last_fail is None else round(last_fail + TICK - KILL_AT, 2)
    return failed, stale

for ttl, hb in [(10, 2.5), (2, 0.5)]:
    f, s = run(ttl, hb)
    fe, se = run(ttl, hb, eject_s=30.0)
    bound = ttl + CACHE
    print(f"TTL {ttl:>2} s, heartbeat {hb} s: failed {f:>5}, stale {s} s (bound ~{bound} s)"
          f" | eject 30 s on failure: failed {fe:>4}, stale {se} s")

alive_avg = (INSTANCES * KILL_AT + (INSTANCES - DEAD) * (RUN - KILL_AT)) / RUN
for hb in (2.5, 0.5):
    print(f"heartbeat every {hb} s: about {alive_avg / hb:.1f} messages/s to the registry")
Run it with python3 discovery_lab.py. On our machine it printed:
TTL 10 s, heartbeat 2.5 s: failed  2043, stale 12.33 s (bound ~13.0 s) | eject 30 s on failure: failed  900, stale 11.54 s
TTL  2 s, heartbeat 0.5 s: failed   608, stale 4.78 s (bound ~5.0 s) | eject 30 s on failure: failed  461, stale 3.57 s
heartbeat every 2.5 s: about 186.7 messages/s to the registry
heartbeat every 0.5 s: about 933.3 messages/s to the registry
What to observe. The counts sit near the lab's 2035 and 623, not on them, because the random draws differ, and both stale windows stay under TTL + cache. Ejection cuts the 10 s setup from 2043 to 900: each caller fails at most once per dead instance, a ceiling of 20 x 50 = 1,000. The ejection must outlive the refresh, or the registry hands the dead address straight back. Set CACHE = 0.5 and the 2 s setup drops further: the cache was the larger part of its window. The last two lines are the ideal heartbeat rates; the lab's 924/s is lower only because of its 10 ms ticks.
Third, the same mechanism in Consul. A service registered with a TTL check stays passing only while something calls the check's pass endpoint:
# orders.hcl: registered with the local Consul agent
service {
  name = "orders"
  id   = "orders-1"
  port = 8080
  check {
    id    = "orders-1-ttl"
    name  = "heartbeat"
    ttl   = "10s"                               # critical if no update for 10 s
    deregister_critical_service_after = "1m"    # then removed from the catalog (minimum 1m)
  }
}
# heartbeat: run every 2.5 s from the service (or a sidecar that checks it first)
curl -s -X PUT http://127.0.0.1:8500/v1/agent/check/pass/orders-1-ttl
# what a caller sees: only instances whose checks are passing
curl -s 'http://127.0.0.1:8500/v1/health/service/orders?passing'
# watch instead of poll: blocks until the index changes or 30 s pass
curl -s -D - "http://127.0.0.1:8500/v1/health/service/orders?passing&index=${LAST_INDEX}&wait=30s"Stop the heartbeat loop and about 10 s later orders-1 leaves the ?passing result; a waiting blocking query returns then with a new X-Consul-Index. In etcd: etcdctl lease grant 10, etcdctl put --lease=<lease-id> /services/orders/10.0.1.7:8080 up, etcdctl lease keep-alive <lease-id>; stop the keep-alive and etcdctl watch --prefix /services/orders/ prints a DELETE about 10 s later. In Kubernetes, kubectl get endpointslices -l kubernetes.io/service-name=orders -o yaml shows a pod's ready condition flip when its readiness probe fails.
Failure modes and edge cases
Alive but not serving. A heartbeat from a background thread says nothing about the request path. Detect it by comparing registry health with per-instance error rates at callers; fix it with checks through the real path plus caller-side ejection. Envoy's outlier detection ejects a host after consecutive_5xx errors (5 by default) for base_ejection_time (30 s, multiplied by consecutive ejections), capped at max_ejection_percent (10%) of the cluster.
Mass removal. A partition or a bad check (a readiness probe that calls a shared database) can mark most instances unhealthy at once. Alert on the healthy fraction per service changing fast; use panic thresholds and last-known lists, and checks that test only the instance itself, the same rule as liveness in server failover.
Flapping. An instance near its limits passes and fails alternately and churns every watcher. Consul's success_before_passing and failures_before_critical, and Kubernetes' successThreshold and failureThreshold, add hysteresis.
Retries without a bound. The lab had no retries, so every stale route was a visible error. A retry to another instance hides most of them, for idempotent requests and within a retry budget; otherwise a large failure becomes a retry storm on the survivors.
Shutdown without draining. A planned stop can have a zero stale window: deregister or fail readiness first, wait at least P + C, then stop accepting connections. Skip the wait and every deploy looks like a crash.
IP reuse. A new pod can get a dead pod's IP, and a stale entry then reaches the wrong service. Use mTLS with service identity, or check the service name on the response.
Trade-offs
| Option | Good for | Costs you | Use when |
|---|---|---|---|
| Hardcoded list or config file | Tiny, static fleets; no moving parts | Never removes dead instances: 8000 failed requests and still failing after 40 s in our lab | A handful of fixed hosts behind a health-checking load balancer |
| Registry, long TTL, polling clients | Low heartbeat and lookup load; tolerant of pauses | Long stale window: 12.5 s (2035 failures) with a 10 s TTL and 3 s cache in our lab | Large fleets where callers retry to another instance anyway |
| Registry, short TTL | Fast detection of silent instances | Heartbeats scale as instances / interval: 924/s vs 186.2/s in our lab; false removals under GC pauses | Small and medium fleets with steady runtimes and a fast network |
| Watches or blocking queries | Removes the client cache term from the stale window | Fan-out on every change, reconnect and resync logic | The stale window matters and the client library supports it |
| Server-side discovery (Kubernetes Service, load balancer) | No client library; one place to tune health | A component in the path to keep available; probe-driven detection (about 30 s with probe defaults) | Polyglot services on one platform |
| DNS-based discovery | Works with every client | Caches you do not control, long-lived connections that never re-resolve | Slow-changing pools, or with short TTLs and connection lifetime caps |
| Client-side ejection and retries | Cuts failures inside any stale window without registry load | Per-caller state; retries must be idempotent and budgeted | Always, as a complement to the registry |
Common mistakes
In an interview
- Clarify: how many instances and services, how often they change, which platform (Kubernetes or VMs), and how many seconds of errors after a crash are acceptable.
- Assumptions: for example 500 instances, 2,000 requests per second, idempotent reads that can be retried.
- Structure: registry (CP store or platform endpoints), registration by an agent or orchestrator, health by checks or heartbeats, propagation by watch, selection in a client library or sidecar.
- Deep dive: the stale window D + P + C with numbers, heartbeat load = instances / interval, why TTL is several intervals.
- Trade-offs: short TTL vs heartbeat load and false removals; CP registry stalls in a partition, AP registry serves stale data; caller-side ejection and retries to cover the window.
- Wrap up: fail static on registry loss, drain before shutdown, measure the window by killing instances on purpose.
Instances register in a service registry, either themselves or through an agent or the orchestrator, and stay listed only while they keep proving they are alive: heartbeats within a TTL, or passing active health checks. Callers get the list either by asking the registry and caching it, client-side discovery, or through a load balancer or proxy that does it for them, server-side discovery. The key number is how long a dead instance keeps getting traffic: roughly detection, up to the TTL, plus propagation, plus the client cache. In a small simulation of 50 out of 500 instances dying, a hardcoded list failed 8000 requests and never recovered, a 10 second TTL failed 2035 over 12.5 seconds, and a 2 second TTL 623 over 4.8 seconds, but at about five times the heartbeats, because heartbeat traffic is instances divided by the interval. So I would use watches instead of long caches, keep the TTL at several heartbeat intervals and above GC pauses, add caller-side ejection and retries to another instance, and make the data plane keep its last known list if the registry is unreachable.
Practice
BeginnerWhat does a service registry store, and who reads it?
The network locations of service instances with their health. Callers read it in client-side discovery; a load balancer or proxy reads it in server-side discovery.
Intermediate2,000 req/s spread evenly over 500 instances, 50 of them dead, and nobody updates the list for 40 s. How many requests fail?
2,000 x 50 / 500 = 200 failures per second, x 40 s = 8,000. The lab counted exactly 8000, because round robin over 500 entries hits each dead one exactly once per cycle.
IntermediateTTL 10 s, heartbeat every 2.5 s, callers cache 3 s. What is the worst-case stale window if propagation is negligible?
Detection up to 10 s (an instance that heartbeated just before dying) plus up to 3 s of cache: about 13 s. The lab's last failure came 12.5 s after the crash.
IntermediateWhy does a 2 s TTL with 0.5 s heartbeats send about 5x the heartbeats of a 10 s TTL with 2.5 s heartbeats?
Heartbeat rate is live instances divided by the interval, and the interval is 5x shorter. With 466.7 instances alive on average that is 933.3/s against 186.7/s ideal; the lab's 10 ms ticks stretched each interval by about 5 ms, giving 924/s and 186.2/s, a ratio of 4.96.
AdvancedYou cut the TTL from 10 s to 2 s but the stale window only fell from 12.5 s to 4.8 s. What is the rest, and how do you remove it?
Mostly the 3 s client cache, plus a little detection. Replace polling with a watch or blocking query so callers learn of the removal as it happens, or shorten the cache, and add caller-side ejection on failure.
AdvancedWith a 2 s TTL and 0.5 s heartbeats, roughly what pause gets a healthy instance removed, and what do you do about it?
About 1.5 to 2 s: the registry needs a full 2 s of silence, and up to about 0.5 s may already have passed since the last heartbeat. Long GC pauses or CPU throttling cross that. Size the TTL above your longest observed pause, send heartbeats from a component that does not pause with the app (a local agent), and use active checks with failure thresholds.
AdvancedA partition separates a Consul server from the majority. What can callers on its side still do?
No leader on the minority side, so no registrations, deregistrations or check state changes reach the catalog there, and default and consistent reads fail. Reads with the stale mode can still be served from that server's last copy. Clients should keep using their last known list rather than treat errors as "no instances".
AdvancedCallers eject an address for 30 s after one failed request. Why must the ejection survive the cache refresh, and what caps the failures?
Until the registry removes the instance, every refresh hands the dead address back, so a mark that ends at refresh is undone within seconds. With a lasting ejection each caller fails at most once per dead instance: 20 callers x 50 dead = 1,000 failures at most; the Python model counted 900.
Cheat sheet
| Term or formula | Meaning |
|---|---|
| Service registry | Live list of instance addresses with health |
| Client-side discovery | Caller queries the registry, caches, picks an instance itself |
| Server-side discovery | Caller hits a stable address; a load balancer or proxy picks the instance |
| Self vs third-party registration | The instance registers itself, or an agent or orchestrator does it |
| Heartbeat vs active check | Instance pushes "alive", or the registry or agent probes the instance |
| TTL, lease | An entry expires unless renewed; a lease deletes its attached keys on expiry |
| Stale window | ≈ D + P + C; worst case ≈ TTL + propagation + cache; lab 12.5 s and 4.8 s |
| Detection with heartbeats | D = TTL - age of the last heartbeat at the crash |
| Heartbeat rate | live instances / interval; 466.7 / 0.5 = 933.3/s ideal, lab 924/s |
| Poll load | callers / cache length; 20 / 3 s = 6.7 lookups/s |
| Failures in the window | dead instances x req/s per instance x time in lists; 50 x 4 x 10.1 ≈ 2,020 (lab 2035) |
| Hardcoded list failures | total req/s x dead fraction x time; 2,000 x 10% x 40 s = 8,000 |
| CP vs AP registry | CP stops changing on the minority side; AP keeps answering with possibly stale data |
| Outlier ejection, panic threshold | Caller drops a failing host for a while; below a healthy fraction, ignore health and spread load |
Further reading
- microservices.io, Service registry: the pattern itself, what a registry stores and the self vs third-party registration choice.
- microservices.io, Client-side service discovery: the client-side pattern with its benefits and its client-library cost, linked to the server-side alternative.
- Consul docs, Define health checks: every check type, including TTL checks and the endpoints that update them, with configuration examples.
- Kubernetes docs, Service: ClusterIP, headless Services, DNS names and how kube-proxy routes to ready pods.
- Kubernetes docs, EndpointSlices: the ready, serving and terminating conditions and why endpoints are split into slices.
- etcd docs, etcd API: the Watch and Lease APIs that let a key-value store act as a registry with lease-based expiry.
- Netflix Eureka wiki, client server communication: the 30 s renewals, 90 s expiry, client registry cache and the up to 2 minute propagation delay.
This article describes general service discovery patterns and the public documentation of Consul, etcd, Eureka, Envoy and Kubernetes. It does not describe any company's private systems, and the diagrams are conceptual. Every lab number comes from a small discrete-event simulation on one machine with a virtual clock and one seed (20); the registry round trip was assumed, not measured, and only the in-process registry query time was measured. It is not a benchmark and not a measurement of any production system.
Frequently asked questions
What is service discovery?
Service discovery is how a caller finds the current network addresses of the healthy instances of a service it wants to call. Instead of a fixed list in config, instances are recorded in a registry (Consul, etcd, Eureka, Kubernetes EndpointSlices) that adds them when they start and removes them when they stop or go silent.
What is the difference between client-side and server-side discovery?
In client-side discovery the caller queries the registry, caches the list and picks an instance itself, so it needs a discovery-aware client library. In server-side discovery the caller sends every request to a fixed address, a load balancer or proxy such as a Kubernetes Service, and that component reads the registry and picks the instance.
How long does traffic keep going to a dead instance?
About detection time + propagation time + the caller's cache time. Detection is up to the TTL for heartbeat-based expiry, propagation is how long the change takes to reach callers (replication, watches, round trips), and the cache adds up to its own length. In our simulation that was 12.5 s with a 10 s TTL and 4.8 s with a 2 s TTL, both with a 3 s client cache.
Why not just set a very short TTL?
Because the heartbeat interval must be shorter than the TTL, and heartbeat traffic is instances divided by interval. In our simulation the 2 s TTL with 0.5 s heartbeats sent 924 heartbeats per second against 186.2 for the 10 s TTL with 2.5 s heartbeats. A short TTL also removes healthy instances that pause briefly, for example during a long garbage collection pause.
Is DNS enough for service discovery?
Often, if you respect its caching. DNS answers are cached by resolvers, operating systems and language runtimes, and clients that keep long-lived connections never look up again. Consul serves DNS with a 0 TTL by default for this reason, and a Kubernetes ClusterIP Service avoids the problem by giving the service a stable virtual IP while kube-proxy tracks the changing pods.
Are these numbers measured on real servers?
No. They come from a small simulation on one machine with a virtual clock and seed 20. Only the in-process registry query time (0.0157 ms) was measured; the 0.7022 ms round trip was assumed from a model. It shows the shape of the trade-off, not production figures.
Sources
- microservices.io: Pattern, Service registrymicroservices.io
- microservices.io: Pattern, Client-side service discoverymicroservices.io
- Consul docs: Define health checksdeveloper.hashicorp.com
- Kubernetes docs: Servicekubernetes.io
- Kubernetes docs: EndpointSliceskubernetes.io
- etcd v3.5 docs: etcd API (Watch and Lease)etcd.io
- Netflix Eureka wiki: Understanding Eureka client server communicationgithub.com

Written by a software engineer and system architect with 10+ years of building production web, payment, ticketing and accounting systems in Japan and Nepal. About us