Series vs parallel availability: two servers in a row
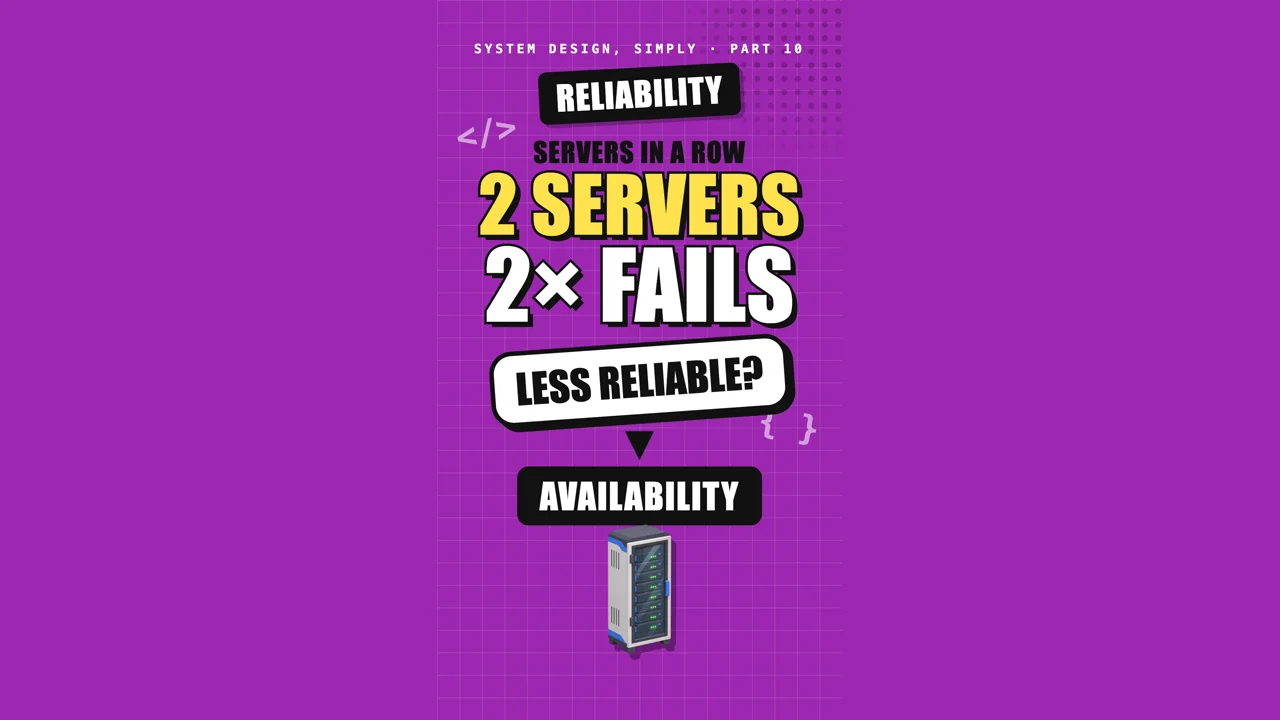
Series vs parallel availability: two independent 99% servers give 98.01% when both are required, or 99.99% when either copy can serve the request.
 Video · 60 secondsWatch the short versionSame diagrams and numbers. Tap to play.
In this lesson you will learn
- Why parts in a row multiply their failures
- Why copies side by side fail so rarely
- How to calculate the availability of a real request path
- The hidden assumption: failures must be independent
Builds on Lesson 8: Race conditions and strong consistency 14 min read + 60 s video Next: Failover: active-passive vs active-active
Drafted with AI assistance, then checked and edited by a human engineer · How we write
Short answer
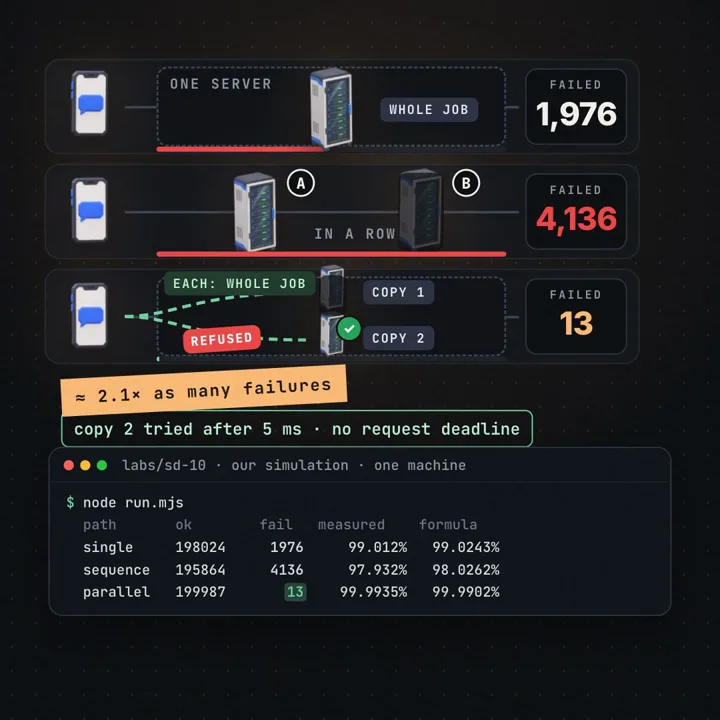
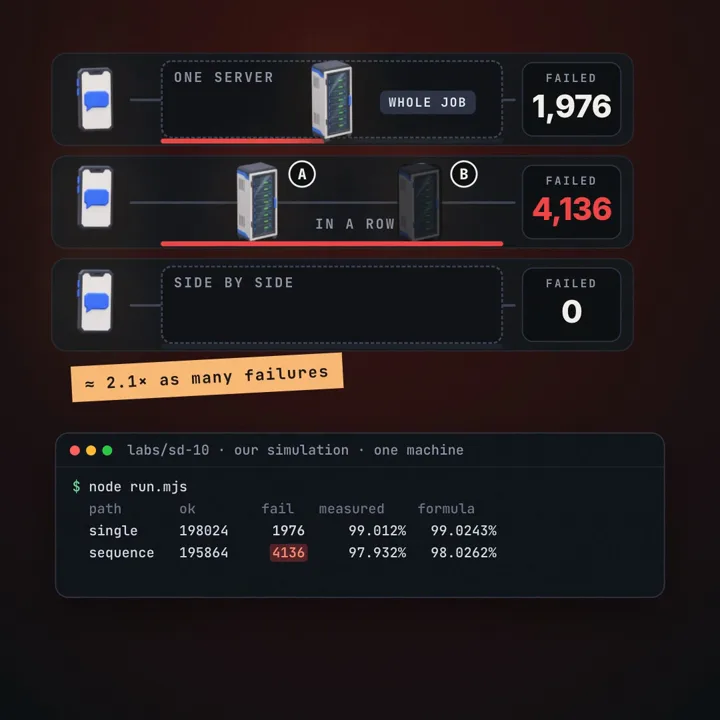
When a request must pass through two servers in a row, both must be up, so availabilities multiply: 0.99 × 0.99 ≈ 98%, about twice the failures of one server. Two copies side by side, where either can do the whole job, fail only when both are down: 1 minus 0.01 × 0.01 = 99.99%. In our simulation of 200,000 requests per path: 1,976 failed with one server, 4,136 in a row, 13 side by side.
| Servers in a row (series) | All must be up: A = a1 × a2 × ... ; two at 99% give 98.01% |
|---|---|
| Copies side by side (parallel) | Any one is enough: A = 1 minus (1 minus a1) × (1 minus a2); two at 99% give 99.99% |
| Our simulation (not production) | 200,000 requests per path, seed 1010: one server 1,976 failed, two in a row 4,136 (≈ 2.1× as many), side by side 13 |
| Measured uptime of the simulated servers | 99.02%, 99.01% and 99.01% (each targets 99%) |
| The catch | The 99.99% assumes independent failures; positive correlation reduces the benefit, and failover delay and survivor capacity must be counted separately |
| Rule of thumb | Every hard dependency on the request path costs nines; redundancy at every required step buys them back |
Series vs parallel availability depends on whether a request needs every component or any one copy. Assuming independent failures, two required servers at 99% availability give 98.01%, nearly twice the failed-request share of one. If instead two copies sit side by side and either one can do the whole job, the request fails only when both are down at once, and failures become rare. A classic interview question asks exactly this: why can adding a server make a system less reliable?
Prerequisites
Availability as a share. Availability is the share of time, or of requests, in which a service does its job. 99% means one moment in a hundred it does not. Part 9 turned these percentages into hours: 99.9% uptime still allows 8.76 hours down a year. Here we only need the share itself, written as a number between 0 and 1: 99% is 0.99.
A request path. One tap in an app is rarely handled by one program. The phone talks to an API, the API calls an authentication service, a database, maybe a payment provider. We traced such a path in how a like reaches your friend. Every program the request must wait on is on its path.
Probability of "and" and "or". If two events are independent, the chance that both happen is the product of their chances. The chance that at least one happens is 1 minus the chance that neither does. This article needs only those two rules, plus the question of when they hold.
Definitions
Series (in a row): components a request must pass through one after another, where every one has to work. If any one is down, the request fails.
Parallel (side by side): redundant copies of the same component, where any single copy can do the whole job. The request fails only if every copy is unavailable.
Hard dependency: a component without which a service cannot answer. A soft dependency is one the service can skip or degrade around (for example, showing a page without recommendations).
Independent failures: failures where one component being down does not change the chance that another is down. Two servers on separate power, network and deploys are closer to independent; two processes on one machine are not.
Failover: moving traffic from a failed copy to a healthy one. It can happen in the client (retry another address), in a load balancer (health checks), or in DNS (subject to health-check detection, TTLs and resolver caching).
Reliability block diagram: a drawing of a system as blocks in series and in parallel, used to compute its availability from the availabilities of its parts.
How does series vs parallel availability work?
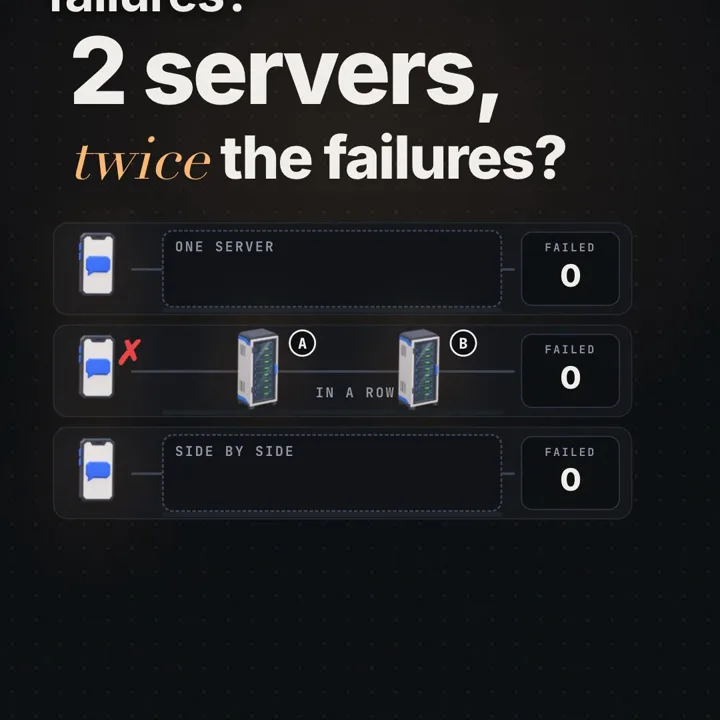
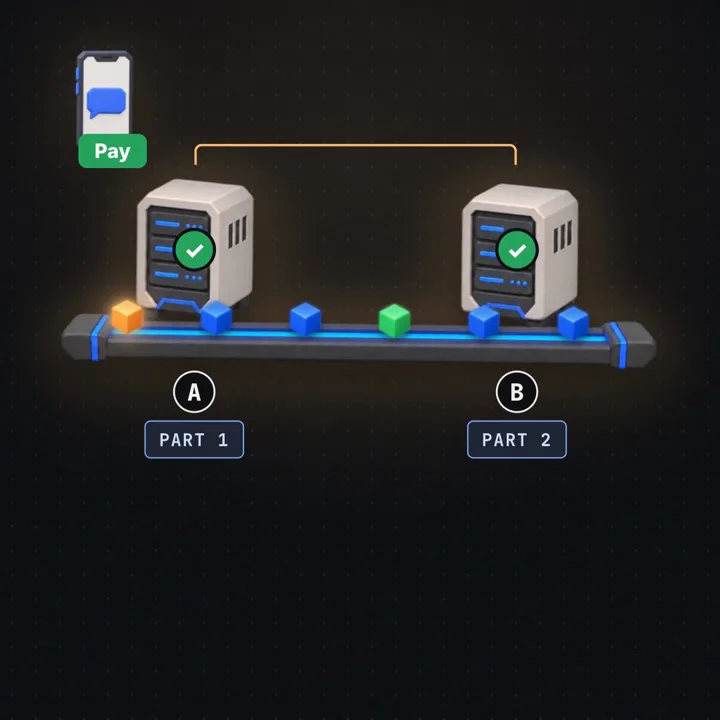
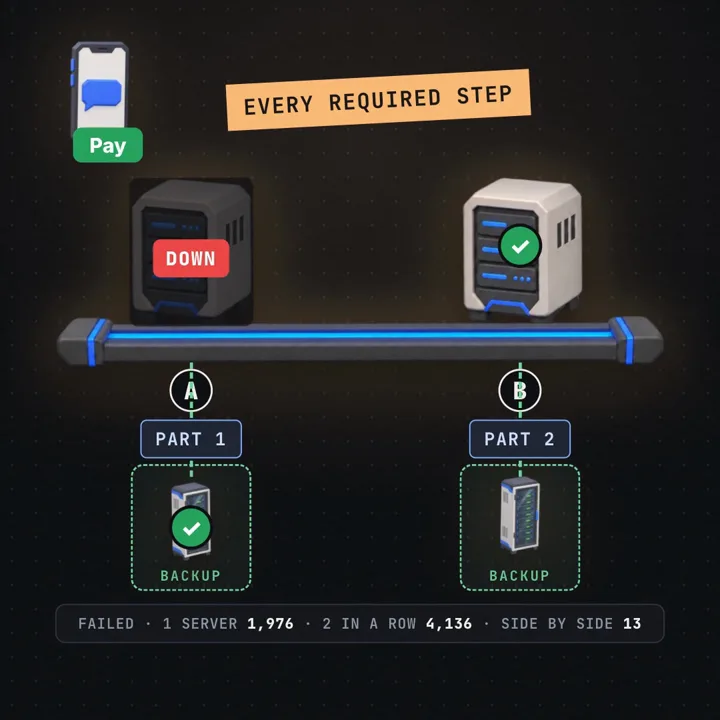
Take a payment request that needs server A to do part of the job and server B to do the rest. A calls B, waits for the answer, then replies. For the request to succeed, A must be up and B must be up at that moment. With independent failures:
availability(A then B) = a(A) × a(B)
                       = 0.99 × 0.99
                       = 0.9801          (98.01%)
failure share          = 1 - 0.9801 = 0.0199   (1.99%, vs 1% for one server)
The failure share nearly doubles, because the second server in the chain brings a second way to fail and no extra capacity or safety. For small failure rates the rule of thumb is that failure shares in series add up: 1% + 1% ≈ 2%. The exact value is a little less (1.99%) because sometimes both are down at the same moment and that request is counted once.
The effect compounds with every hard dependency on the path. A service that calls ten other services, each at 99.9%, is at most 0.999¹⁰ ≈ 99.0% if every call is required. Ten dependencies at 99% give 0.99¹⁰ ≈ 90.4%. This is why architects count synchronous calls on the hot path, and why a microservice split that turns one process into five chained services can lower availability even when each new service is "just as reliable" as the old monolith.
| Servers in a row, each at 99% | Availability | Failed per 100,000 requests |
|---|---|---|
| 1 | 99.00% | 1,000 |
| 2 | 98.01% | 1,990 |
| 3 | 97.03% | 2,970 |
| 5 | 95.10% | 4,901 |
| 10 | 90.44% | 9,562 |
Series also applies to things that are not servers. The client's network, DNS, TLS certificates, the load balancer, a feature-flag service the code reads on every request, a secrets manager: if the request cannot complete without it, it is a block in the row.
Side by side: why copies fail so rarely
Now put two copies of the whole-job server side by side. The client sends the request to copy 1; if copy 1 refuses, it tries copy 2. The request fails only when both are down at the same time:
chance both are down        = (1 - 0.99) × (1 - 0.99) = 0.01 × 0.01 = 0.0001
availability(copy 1 or 2)   = 1 - 0.0001 = 0.9999        (99.99%)
three copies                = 1 - 0.01³  = 0.999999      (99.9999%)
Each extra independent copy multiplies the failure share by the failure share of one copy. On paper, two copies at two nines give four nines, and three give six.
"Side by side" has three requirements. Each copy must be able to do the whole job on its own. The client (or a load balancer in front) must know about both copies and must be able to switch within the request's deadline. And the survivor must have the capacity to take the load of both. If any of these is missing, the formula overstates the result.
Real request paths: mixing both
Real systems are drawn as blocks in series where some blocks are themselves groups of copies in parallel. You compute from the inside out: first each parallel group, then multiply the groups along the path.
load balancer pair      1 - 0.001²         = 0.999999
app servers (3 copies)  1 - 0.01³          = 0.999999
database primary only                       = 0.999
path = 0.999999 × 0.999999 × 0.999          ≈ 0.998998   (99.90%)
The weakest block dominates. Three app servers bought six nines for their layer, but the single database caps the path at three. This is the practical rule the video ends on: put a reachable backup at every step the request needs, since redundancy at one layer does nothing for a layer that is still single.
The same thinking explains common designs. A load balancer with health checks turns several app servers into one parallel block. A primary and standby provide redundancy, but promotion can interrupt service, so the ideal parallel formula overstates the pair. Count detection and promotion time, replication lag, and shared failures (the next part of this series asks who takes over when the main server dies at 3 a.m.). A cache in front of a database is neither: if the code falls back to the database on a cache miss, the cache is a soft dependency; if it does not, it is one more block in series.
Latency follows the opposite rule from availability. In series, latencies add; in parallel with "first answer wins" (hedged requests), the tail latency drops. We saw how waiting stacks up in fast alone, slow in a crowd and ten lanes, still slow.
Independence, the assumption that does all the work
Both formulas assume independent failures. Series is fairly forgiving about this: if A and B tend to fail at the same moments, the chain does a little better than the product, because their outages overlap. Parallel is the opposite: the more often both copies fail together, the less the redundancy is worth.
Common reasons copies fail together:
- Shared dependency: both app servers read the same database. When it is down, both are effectively down, so the "parallel" group is really in series with the database.
- Same change, same time: a bad configuration or release rolled out to every copy at once. This is one of the most common causes of large outages, and the reason staged rollouts exist.
- Same physical place: one rack, one power feed, one availability zone, one region.
- Load shift: copy 1 fails, copy 2 receives double traffic and falls over too. The Google SRE book's chapter on cascading failures describes this pattern in detail.
- Retry storms: clients that retry immediately and without limits multiply the load on the survivor exactly when it is weakest.
For ideal reachable copies, availability is 1 minus P(both down). Independence gives 99.99% for two 99% copies. Positive correlation reduces that benefit; nonoverlapping outages can provide 100%. Separately account for failover delays and for the survivor's capacity, which the formula leaves out.
Worked example
The video uses one tap on a Pay button and three lanes doing the same job. We simulated them on one machine with Node.js (labs/sd-10, seed 1010, 200,000 requests per path at the same arrival times). Each simulated server targets 99% uptime with random outages of 10 to 30 ms; the measured uptimes were 99.02% (the single server), 99.01% (A) and 99.01% (B).
path           ok        failed   measured   formula (measured uptimes)
single         198,024   1,976    99.012%    99.0243%
sequence A→B   195,864   4,136    97.932%    98.0262%
parallel A|B   199,987   13       99.9935%   99.9902%

ratio in a row vs one:  4,136 / 1,976 = 2.09   (≈ 2.1× as many failures)
math, not measured:     0.99 × 0.99 = 0.9801   (≈ 98%)
parallel detail:        copy 2 tried 5 ms after copy 1 refused, no request deadline
                        (the client fell back to B 2,067 times)
Assumptions to state out loud: these are schedules of up and down time, not network servers; outages are short and independent by construction; nothing times out. The measured rates wobble around the formulas because of sample size (parallel failures are so rare that a different seed can give noticeably more or fewer). The counts still have the expected shape: about double the failures in a row, almost none side by side.
Code
This short Python script computes both formulas and checks them with a simple simulation where each request samples each server independently. It runs with the standard library only.
# chain_vs_copies.py: availability of a chain and of side-by-side copies, by formula and by simulation
import random

def chain(*a):
    """Every part must be up: multiply."""
    p = 1.0
    for x in a:
        p *= x
    return p

def copies(*a):
    """Any one copy is enough: 1 minus the chance that all are down."""
    q = 1.0
    for x in a:
        q *= (1 - x)
    return 1 - q

a = 0.99
print(f"one server        {a:.4%}")
print(f"two in a row      {chain(a, a):.4%}")
print(f"two side by side  {copies(a, a):.4%}")
print(f"ten in a row      {chain(*[a] * 10):.4%}")

# simulate: each request samples each server independently (up with probability a)
random.seed(1010)
N = 200_000
fail = {"one": 0, "row": 0, "side": 0}
for _ in range(N):
    s, x, y = (random.random() < a for _ in range(3))
    fail["one"] += not s
    fail["row"] += not (x and y)
    fail["side"] += not (x or y)
print("failed of", N, fail)
What to observe: the formulas print 99.0000%, 98.0100%, 99.9900% and 90.4382%. The simulation prints about 2,000 failures for one server, about 4,000 in a row and about 20 side by side (exact counts depend on the seed; with seed 1010 it gave 1,928, 3,935 and 21). Change a to 0.999 and watch the parallel count drop to almost zero. Then make the copies share a cause by setting y = x, a one-line model of correlated failure, and the side-by-side failures jump to the single-server level.
The lab behind the video (labs/sd-10/run.mjs) differs in one way: it uses outage schedules in simulated time instead of a coin flip per request, so neighbouring requests see the same outage, like real traffic does.
Failure modes and edge cases
Failover slower than the deadline. If the client waits 2 seconds for copy 1 before trying copy 2, and the user's request times out after 1 second, the copy is useless. Set per-attempt timeouts well under the overall deadline; the Amazon Builders' Library article on timeouts and retries explains how to choose them from latency percentiles.
Health checks that lie. A load balancer only routes around a copy it knows is broken. A health check that returns 200 while the database behind it is down keeps sending traffic to a dead copy. Check the dependencies the request needs, but carefully, or every copy fails its check together when a shared dependency blips.
Survivor overload. Two copies each at 70% CPU cannot absorb each other's traffic. Plan for N+1: enough capacity that losing one copy still leaves the rest below their limit.
Retries that duplicate work. A request that timed out may have succeeded. Retrying a payment without an idempotency key can charge twice. Make writes idempotent, or let the client send a key that the server deduplicates.
Retry amplification in deep chains. If each of five layers makes up to three attempts, including the initial attempt, one user request can become 3⁵ = 243 calls at the bottom. Retry at one layer (usually the edge), add backoff with jitter and a retry budget.
Hidden series blocks. A shared config service, DNS, a certificate that expires, a single NAT gateway: anything every copy needs is a block in series with the whole group. Draw the full diagram, not only the servers you own.
Trade-offs
| Option | Good for | Costs you | Use when |
|---|---|---|---|
| One server | Simplicity, cost | Every outage is a user-visible failure | Prototypes, internal tools, batch jobs that can wait |
| More services in a row | Team ownership, separate scaling, clearer code boundaries | Each hard call adds failure share and latency | The split is worth it and calls can be made soft (cached, async, optional) |
| Copies behind a load balancer | Stateless app servers | More machines, health checks, N+1 capacity | Almost always for user-facing request handlers |
| Client-side retry to another copy | Fast failover without extra hops | Duplicate work unless idempotent; retry storms | Reads, idempotent writes, with budgets and jitter |
| Primary plus standby database | Stateful data | Replication lag, failover time, split-brain risk | The data layer is the weakest block on the path |
| Copies in separate zones or regions | Surviving shared-location failures | Latency between copies, cost, data consistency work | Targets above about three nines |
Common mistakes
In an interview
- Clarify: which calls are required for the request, and which can be skipped or degraded?
- Assumptions: state an availability per component (for example 99.9%) and say you assume independent failures.
- Structure: draw the path as blocks in series; mark which blocks have copies in parallel.
- Deep dive: compute the path: parallel groups first (1 minus the product of failure shares), then multiply along the path. Point at the weakest block.
- Trade-offs: redundancy costs capacity and complexity; failover time and correlated failure eat into the formula.
- Wrap up: the fix is a reachable backup at every required step, plus fewer hard dependencies on the hot path.
If a request has to go through two servers in a row, both must be up, so availabilities multiply: two servers at 99% give about 98%, roughly double the failures. That is why every hard dependency on the request path costs nines. If instead two copies sit side by side and either can do the whole job, the request fails only when both are down: 1 minus 0.01 squared, 99.99%. That only holds if the copies fail independently, the client can reach the other copy within its deadline, and the survivor has capacity. So I would draw the path, find the blocks that are single, add redundancy there first, make non-critical calls optional, and keep failover fast and retries bounded and idempotent.
Practice
BeginnerTwo servers in a row, each 99.9% available. What is the path's availability?
0.999 × 0.999 = 0.998001, about 99.8%. The failure share goes from 0.1% to about 0.2%.
BeginnerTwo independent copies side by side, each 99.9%. What is the pair's availability?
1 minus 0.001 × 0.001 = 0.999999, six nines on paper.
IntermediateA path has a load balancer pair (99.99% each), three app servers (99% each) and one database (99.95%). Estimate the path.
LB pair: 1 minus 0.0001² ≈ 1. App group: 1 minus 0.01³ = 0.999999. Path ≈ 1 × 0.999999 × 0.9995 ≈ 99.95%. The database is the cap.
IntermediateWhy can a chain do slightly better than the product of its parts in a simulation?
When outages overlap, one failed request is counted once for the chain but would be counted for both parts. Positive correlation between outages helps a series path a little.
IntermediateA service calls a recommendations API on every page. How do you stop it lowering availability?
Make it a soft dependency: short timeout, fall back to a cached or empty list, and render the page anyway. It leaves the series path.
AdvancedTwo copies at 99%, but 30% of copy 1's outages are bad deploys that also hit copy 2. Roughly what happens?
About 0.3% of the time both are down together from the shared cause, so the pair is near 99.7% at best, far from 99.99%. Correlated failure dominates the formula.
AdvancedYour client retries 3 times at each of 4 layers. Worst-case calls at the bottom per user request?
Each layer makes up to 4 attempts (1 plus 3 retries): 4⁴ = 256. Retry at one layer with a budget instead.
AdvancedWhen is retrying a payment on another copy unsafe, and what fixes it?
When the first attempt may have succeeded but the reply was lost. An idempotency key lets the server return the first result instead of charging again.
Cheat sheet
| Term or formula | Meaning |
|---|---|
| Series: a1 × a2 × ... | All blocks needed; availability multiplies, failure shares roughly add |
| Parallel: 1 minus (1 minus a1)(1 minus a2)... | Any copy is enough; failure shares multiply |
| Two at 99% in a row | 98.01%, about twice the failures |
| Two at 99% side by side | 99.99%, if independent and failover works |
| Hard vs soft dependency | Required for the answer vs skippable with a fallback |
| Correlated failure | Copies failing together; erases the parallel benefit |
| N+1 capacity | Enough copies that losing one still serves the load |
| Idempotency key | Lets a retried write return the first result instead of repeating it |
Further reading
- Google SRE book, Embracing Risk: how availability is measured by time and by requests, and why targets are a business choice.
- Google SRE book, Addressing Cascading Failures: how losing one copy overloads the rest, and how to stop retries from making it worse.
- AWS Well-Architected, Reliability pillar: worked availability calculations for dependencies and redundant components.
- Amazon Builders' Library, Timeouts, retries and backoff with jitter: choosing per-attempt timeouts and avoiding retry storms.
- Wikipedia, Reliability block diagram: the series and parallel block notation used in this article.
- Stripe API docs, Idempotent requests: a concrete, widely used design for safe retries of writes.
This article describes general patterns and our own small simulation. It does not describe any company's private systems. The simulated numbers show the shape of the effect, not production measurements.
Frequently asked questions
Why are two servers in a row less reliable than one?
Because the request needs both. If each is up 99% of the time and they fail independently, both are up 0.99 × 0.99 = 98.01% of the time. The failure share goes from 1% to about 2%, so roughly twice as many requests fail. In our simulation it was 4,136 against 1,976 out of 200,000.
How do I calculate the availability of servers in parallel?
Multiply the chances that each copy is down, then subtract from 1. Two copies at 99% are both down 0.01 × 0.01 = 0.0001 of the time, so the pair is available 99.99%. This assumes independent failures and that a request can actually switch to the other copy.
Does adding a second server always improve availability?
No. A second server in the request path (one calls the other) lowers availability. A second copy that can do the whole job, behind a load balancer or a client retry, raises it, but only if the two copies do not share the cause of failure: the same database, network, region or bad deploy.
What breaks the parallel formula in real systems?
Correlated failures (a shared dependency or a bad config pushed to both copies), failover that is slow or broken, not enough capacity on the survivor, and retries that arrive after the client has already given up. Positive correlation pulls the pair below 1 minus the product of failure shares, and slow failover or missing capacity add failures on top of it.
Were the numbers in the video measured on real servers?
No. They come from a small in-process simulation on one machine (Node.js 22, seed 1010) with simulated outage schedules, not network servers. It shows the shape of the effect. The parallel path retried copy 2 after 5 ms and had no request deadline.
Is retrying a failed request always safe?
Only if the operation is idempotent or the server can recognise the retry. Retrying a payment whose result is unknown can charge twice; APIs such as Stripe accept an idempotency key so a retried request returns the first result instead of repeating the action.
Sources
- Google SRE book: Embracing Risk (measuring availability)sre.google
- Google SRE book: Addressing Cascading Failuressre.google
- AWS Well-Architected Framework, Reliability pillar: Availabilitydocs.aws.amazon.com
- Amazon Builders' Library: Timeouts, retries and backoff with jitteraws.amazon.com
- Wikipedia: Reliability block diagramen.wikipedia.org
- Stripe API docs: Idempotent requestsdocs.stripe.com

Written by a software engineer and system architect with 10+ years of building production web, payment, ticketing and accounting systems in Japan and Nepal. About us