Vertical vs horizontal scaling: one server or eight?
Vertical vs horizontal scaling in our simulation: one 8-core server vs eight 1-core servers, a near tie when matched, 30.23% vs 0.54% failed after a crash.
In this lesson you will learn
- What vertical and horizontal scaling change, and why a shared lock and contention cap one bigger machine
- Why one shared queue lowers waiting in the M/M/8 model, and why our matched simulation still came out close to a tie
- Why losing 1 of N instances costs about 1/N of traffic for the detection time, while losing the only server costs everything until it restarts
Builds on Lesson 17: Layer 4 vs layer 7 load balancing 4 min read Next: SQL vs NoSQL
Drafted with AI assistance, then checked and edited by a human engineer · How we write
Short answer
Vertical scaling gives one machine more resources; horizontal scaling adds service instances across machines. In our simulation (assumed costs, seed 1818), one 8-core server and eight 1-core servers nearly tied with matched costs (1,617 vs 1,579 req/s). Killing the only server failed 30.23% of requests in a 10 s test; killing 1 of 8, ejected after 375 ms, failed 0.54%.
| Baseline throughput at 8 cores | Short-window completion rates: one 8-core server 1,198 requests/s; 8 one-core servers behind round robin 1,413/s |
|---|---|
| How much is assumption | Changing only the assumed contention penalty (0%, 1.5%, 3%, 6% per extra core) gave 1,398, 1,289, 1,198 and 1,027 requests/s, a wider range than the 215 requests/s baseline gap |
| Matched setup | Same async store, no contention, no hops: 1,617 vs 1,579 completed requests/s, both near the 1,600/s ceiling of 8 cores at 5 ms per request |
| Kill test, one big server | 10 s at 839 req/s, killed at 4 s, 3 s restart, no retries: 2,543 of 8,413 requests failed (30.23%) |
| Kill test, 1 of 8 small servers | 45 of 8,387 requests failed (0.54%); health checks every 250 ms, ejected after 2 misses, 375 ms after the kill |
| Setup | Our discrete-event queueing simulation (labs/sd-18) with assumed costs, one seed (1818), run on one Apple M2 Pro with Node v22.13.1; re-run on 2026-11-05 with identical output. Not a benchmark |
Vertical vs horizontal scaling means giving one machine more resources or adding service instances across machines. Choose using measured workload limits and failure requirements: our simulation shows how assumed costs change throughput and how detection time limits failed traffic after one instance dies.
Vertical vs horizontal scaling in our simulation
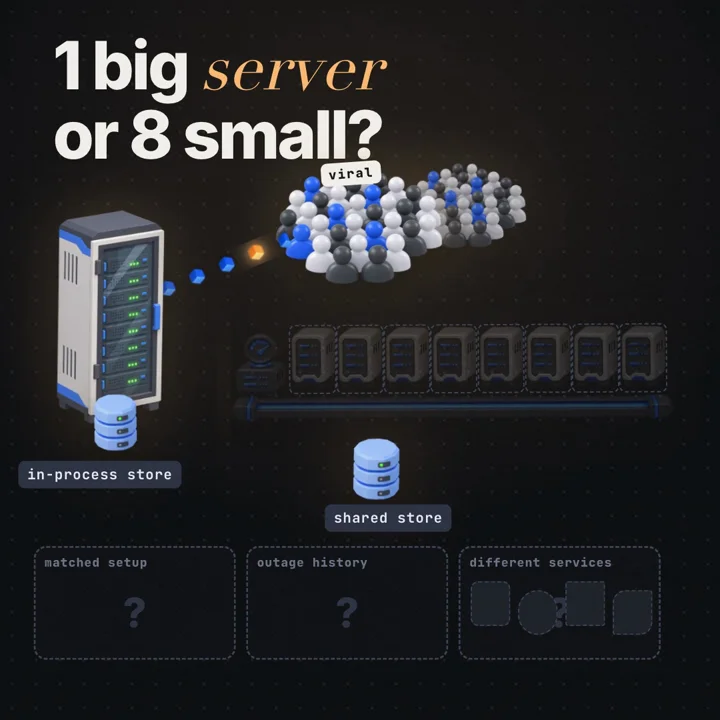
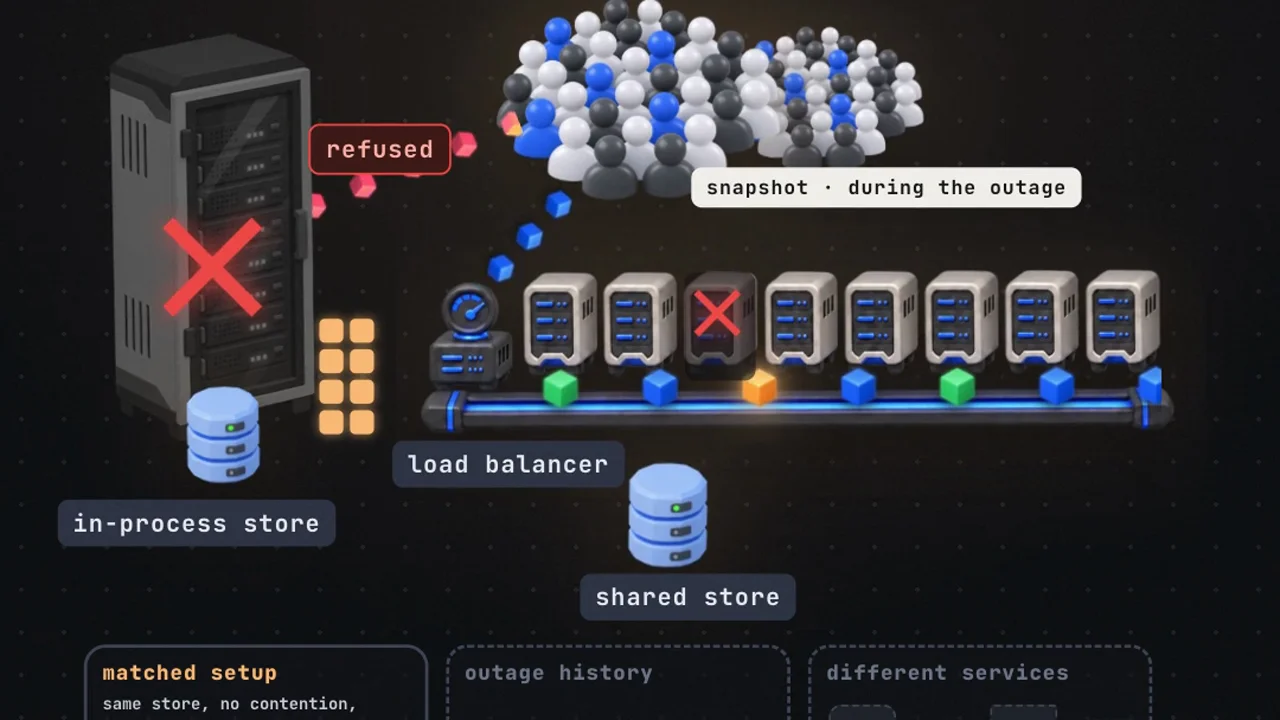
Scaling up gives one machine more resources. Threads can share an address space; worker processes ordinarily use separate address spaces, as the Linux fork(2) page describes. Our vertical model assumes one queue feeding all cores. Scaling out runs N copies behind a load balancer (covered in load balancer vs reverse proxy), and anything the copies share must live where all of them can reach it.
The lab (labs/sd-18) is a discrete-event simulation in virtual time. Each request needs Erlang-2 CPU time with a 5 ms mean plus one store read; arrivals are Poisson. Every cost below is a number we chose:
vertical:   1 instance, 8 cores, one shared queue
            store in-process behind one mutex, mean hold 0.4 ms, core held while waiting
            assumed contention: +3% CPU per request per extra core
horizontal: 8 one-core instances, round robin
            LB hop 0.3 ms each way; separate store, 0.25 ms hop each way, 0.15 ms per read
            +0.3 ms CPU to encode and decode the store reply
These are completion rates at the highest tested step that passed our short-window checks: no errors, p95 at most 200 ms, and backlog growth no greater than the larger of the core count or 2% of window arrivals. They are not estimates of long-run sustainable capacity.
| Cores | Vertical done/s | Horizontal done/s |
|---|---|---|
| 2 | 342 | 371 |
| 4 | 661 | 747 |
| 8 | 1,198 | 1,413 |
| 8, matched costs | 1,617 | 1,579 |
Most of the baseline gap comes from the costs we chose. The matched run gives both sides the same async store with no contention, hops or encoding, so each request costs 5 ms of core time and both ceilings are 8 / 5 ms = 1,600/s. The results landed within 2.4% of each other; the vertical 1,617 sits 1% over the ceiling because random service times and the backlog at the window start vary over a 3 second window. With one seed and no confidence interval, we call it a tie. The matched run also changes three things at once, so it does not isolate any single cause.
What caps one bigger server
Amdahl's law describes speedup for a fixed workload with a serial fraction. Here, the shared mutex serializes store access across requests; its mean 0.4 ms hold gives a separate upper bound of 2,500 reads/s.
The "+3% per extra core" is a simplified contention model, loosely the σ term of Neil Gunther's Universal Scalability Law, applied to CPU time only. At 8 cores each request costs 5 × (1 + 0.03 × 7) = 6.05 ms of CPU, plus the 0.4 ms lock hold. Each simulated core is one worker slot, which remains occupied during lock waiting. A real thread blocked on a sleeping mutex can release the CPU, so this worker-capacity limit depends on the application's thread model (Linux lock types separates sleeping locks from spinning ones). Dividing 8 slots by that occupancy gives a ceiling, and the lab lands a few percent under it:
| Contention | Minimum worker occupancy per request | Ceiling | Lab short-window |
|---|---|---|---|
| 0% | 5.400 ms | 1,481/s | 1,398/s |
| 1.5% | 5.925 ms | 1,350/s | 1,289/s |
| 3% (base) | 6.450 ms | 1,240/s | 1,198/s |
| 6% | 7.500 ms | 1,067/s | 1,027/s |
The sweep moves the big server by 371/s, more than the whole 215/s baseline gap. On real hardware the contention comes from memory bandwidth, NUMA, cache lines bouncing between cores and garbage collection. You find it by load testing at several core counts. The lab also ignores the hardest vertical ceiling, the largest instance your provider sells.
One shared queue or eight
With one queue feeding 8 cores, no core sits idle while work waits elsewhere. With exponential 5 ms service:
load       util   P(wait) M/M/8   P(wait) split M/M/1   mean wait M/M/8   mean wait split
599 /s     0.37   0.013           0.374                 0.01 ms           2.99 ms
839 /s     0.52   0.074           0.524                 0.10 ms           5.51 ms
1,200 /s   0.75   0.357           0.750                 0.89 ms           15.00 ms
1,500 /s   0.94   0.807           0.938                 8.07 ms           75.00 ms
Under this M/M/8 versus randomly split M/M/1 comparison, pooling lowers waiting probability and mean queueing delay. The table does not predict the lab's latency. The lab uses Erlang-2 service, which varies less than exponential, and round robin, which sends each instance far more regular arrivals than a random split. Both shrink the gap, and short-window throughput is set mostly by the 1,600/s ceiling anyway. Least-connections and power-of-two-choices balancing recover part of the pooling benefit; which server gets your request compares them, and the Google SRE chapter on datacenter load balancing shows how uneven plain round robin gets in practice.
What happens when an instance dies
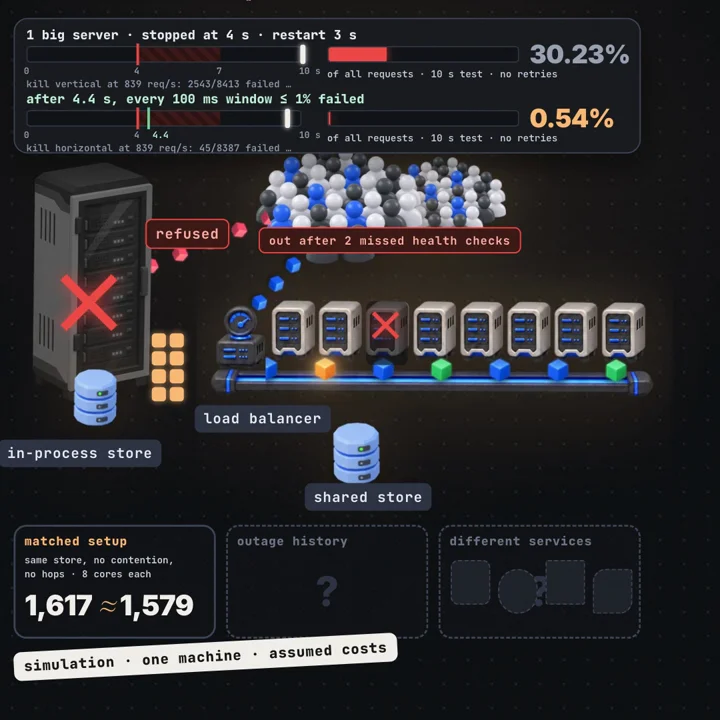
The lab runs each 8-core baseline for 10 simulated seconds at 839 req/s (70% of 1,198), kills one instance at 4 s, restarts it after 3 s, and clients never retry.
The big server loses everything in flight and refuses every arrival until the restart. Little's law gives a service-only approximation of in-flight work: 839/s × 6.45 ms ≈ 5.4 (total residence time also includes queueing and lock waiting). The lab lost 5.
one big server   expected ≈ 839/s × 3 s + 5 in flight ≈ 2,522
                 lab: 2,543 of 8,413 failed = 30.23%
1 of 8 small     checks every 250 ms from 125 ms, eject after 2 misses
                 misses at 4.125 s and 4.375 s, ejected 375 ms after the kill
                 expected ≈ 839/s ÷ 8 × 0.375 s + 1 in flight ≈ 40
                 lab: 45 of 8,387 failed = 0.54%
Losing 1 of N costs about 1/N of traffic for the detection time. With 250 ms checks and 2 misses, detection lands between about 250 and 500 ms depending on where the crash falls. What happens when the main server dies at 3 a.m. tunes those settings for failover.
The survivors need room for the extra load. Equally loaded instances at utilization u survive one loss only if u × N / (N − 1) < 1. In our test the 7 survivors ran near 64%. For eight equally loaded instances at 95%, losing one raises required utilization to 0.95 × 8 / 7 ≈ 109%, exceeding capacity.
Retries may recover some failed requests when deadlines and retry limits allow. They add traffic and require safe handling of repeated operations; this lab does not model them.
Replicas improve availability when some failures leave usable copies and routing can reach them. Shared dependencies and correlated failures reduce that benefit. Parts in series multiply their availability, as two servers in a row shows. The load balancer and the shared store sit in series with every instance, and the lab never fails them. The AWS Well-Architected reliability pillar asks for a failure plan at every layer.
What scaling out asks of your app
For interchangeable web replicas, any healthy instance should be able to serve any request:
| State | Move it to |
|---|---|
| Sessions | A shared store or a signed cookie; sticky sessions break when that instance dies |
| Uploads | Object storage |
| In-process cache | Local caches are usable; scaling and routing changes can cause cold misses or duplicate cached data |
| Cron jobs | A queue or a lock, or they run N times |
| Database | Read replicas (one database writes, ten read); writes need a bigger primary or partitioning |
Once instances are stateless, an autoscaler can set the count:
apiVersion: autoscaling/v2
kind: HorizontalPodAutoscaler
metadata:
  name: api
spec:
  scaleTargetRef: { apiVersion: apps/v1, kind: Deployment, name: api }
  minReplicas: 3               # minimum replica count; placement needs separate configuration
  maxReplicas: 20
  metrics:
    - type: Resource
      resource:
        name: cpu
        target: { type: Utilization, averageUtilization: 60 }
  behavior:
    scaleDown:
      stabilizationWindowSeconds: 300
The base formula targets 60% of requested CPU, subject to tolerance, readiness and scaling policies. Downscaling uses the highest recommendation from the previous 300 seconds. At 8 pods averaging 90%, the base formula asks for ceil(8 × 90 / 60) = 12 (Kubernetes HPA docs). The Deployment must set resources.requests.cpu. Spread replicas across nodes, and across zones when required. Keep enough surviving capacity for the failure you plan to tolerate.
Run the lab
Node.js 22, standard library only, about 0.3 s of wall time:
node labs/sd-18/run.mjsmatched store, vertical 8 core | ... 1617 done/s ...
matched store, horizontal 8 x 1 | ... 1579 done/s ...
kill vertical at 839 req/s: 2543/8413 failed, in flight at kill 5 (lost 5) ...
kill horizontal at 839 req/s: 45/8387 failed, in flight at kill 4 (lost 1) ...The seed is fixed, so the output repeats exactly. Edit contentionPerExtraCore or lockHoldMs to move the vertical rows, healthEveryMs or healthFailsToEject to move the horizontal kill line, and seed to see the noise one seed hides. The full output is in labs/sd-18/run-output.txt.
What we saw when we ran it
We ran node labs/sd-18/run.mjs on our Mac and it finished in 0.3s of wall time. The screen printed one row per setup, then a latency line at 599 req/s on 8 cores (p95 of 15.1 ms for the big server and 14.7 ms for the small servers), then the two kill lines, then the wall time and a RESULT line of JSON.
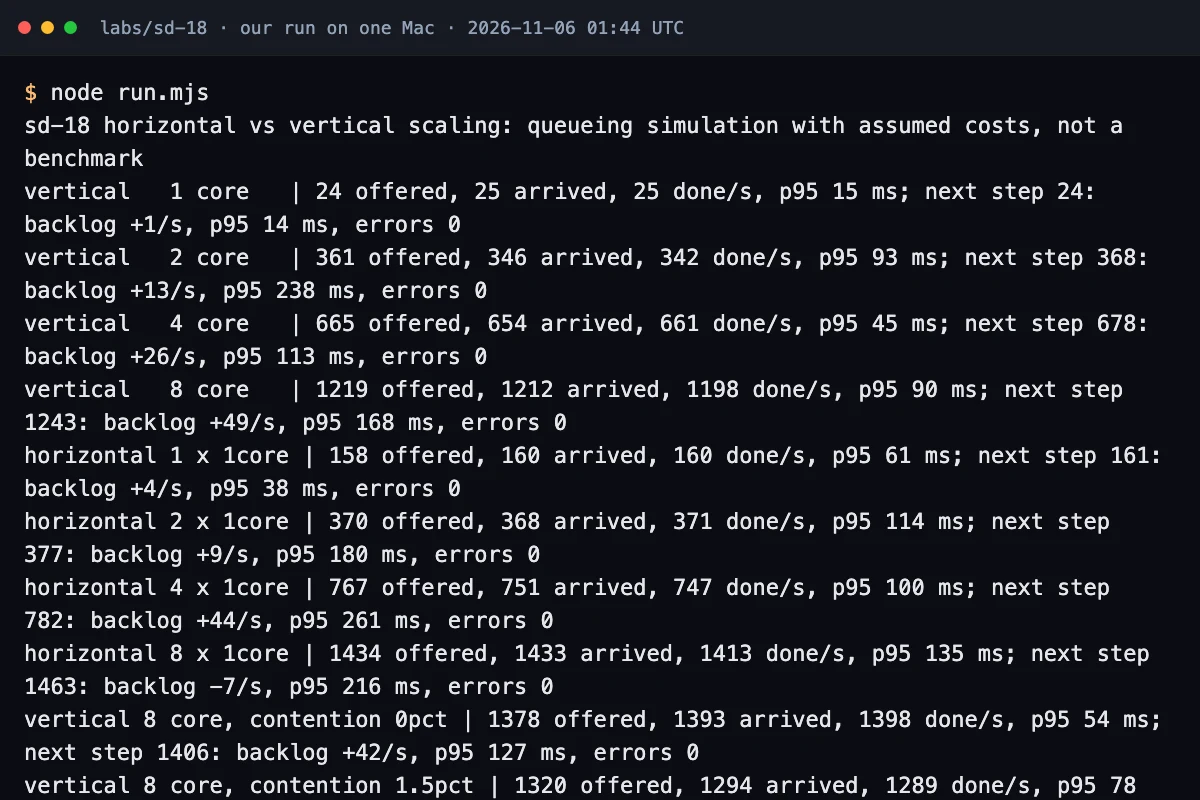 Our terminal after the sd-18 lab run, with the throughput rows and the two kill lines.
In the short test windows, 8 small servers completed 1413 requests/s and the 8-core server 1198; as above, these say nothing about what either setup could carry for a long time. With matched store costs, the 8-core server completed 1617/s and the 8 small servers 1579/s, close enough that the costs we assumed were doing most of the work.
The kill lines surprised us more. At 839 req/s, stopping the big server failed 2543 of 8413 requests. Stopping 1 of 8 small servers failed 45 of 8387, and the last 100 ms window with more than 1% failures ended 0.4s after the kill. We would take that number into a design review, since spreading load across instances shrinks how much traffic one crash can take with it.
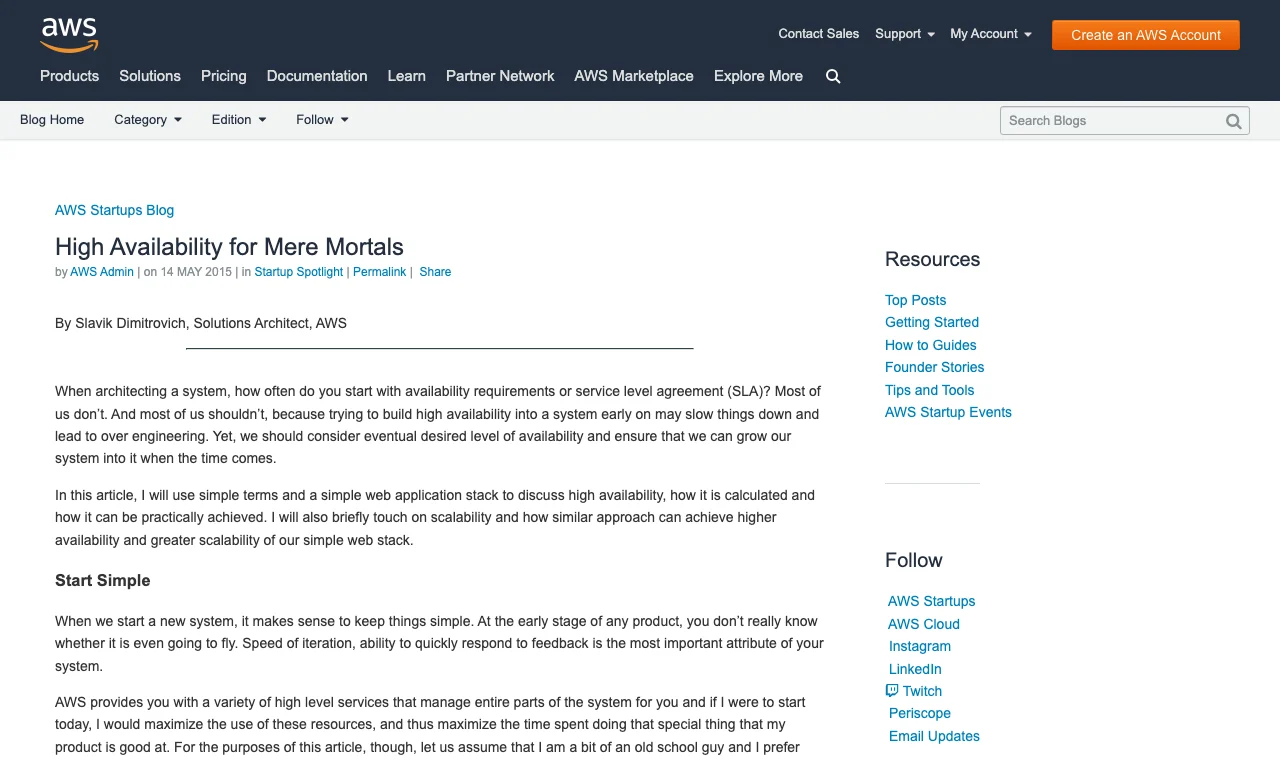 The AWS Startups blog post "High availability for mere mortals", from our source list.
That post covers the availability side: a service running on one server has nothing left to answer requests when that server goes down.
Our take
Our model could not pick a throughput winner. The result followed the costs we assumed, so measure contention and store costs on your own service before trusting either design. The crash arithmetic holds up better: one instance out of N costs about 1/N of traffic for the detection time, provided the survivors have headroom, while the only server costs everything until it restarts. For a typical web product we would scale the stateless tier out with spread replicas and N − 1 headroom, and scale the database up with replicas until it needs partitioning. A single machine is still a fair choice when the load fits with room to spare and a few seconds of downtime is acceptable; a fast server can still be slow for a million users explains why that room matters.
This article describes general scaling patterns, public documentation and our own queueing simulation. It does not describe any company's private systems, and the diagrams are conceptual. Every lab number comes from a simulation in virtual time with costs we assumed, one seed (1818), run on one Apple M2 Pro under Node v22.13.1; it is not a benchmark of any machine, cloud or server.
Frequently asked questions
Is horizontal scaling always faster than vertical scaling?
No. In our simulation the baseline gap came from assumed contention and store costs, and with matched costs one 8-core server and eight 1-core servers nearly tied (1,617 vs 1,579 req/s).
Why is one big server a single point of failure?
Every request depends on it, so a crash fails everything until it restarts: 30.23% of a 10 second test with a 3 second restart. Losing 1 of 8 failed 0.54%, because only an eighth of traffic reached the dead instance until health checks removed it.
What does an app need before it can scale horizontally?
Interchangeable replicas need sessions and uploads accessible after an instance fails. Scheduled work needs coordination to prevent duplicate execution. Check whether the shared database can handle the added load.
Sources
- AWS Startups blog: High availability for mere mortalsaws.amazon.com
- Linux man pages: fork(2)man7.org
- Linux kernel docs: Lock types and their ruleskernel.org
- Neil Gunther: How to quantify scalability (USL)perfdynamics.com
- Google SRE book: Load Balancing in the Datacentersre.google
- Kubernetes docs: Horizontal Pod Autoscalingkubernetes.io
- AWS Well-Architected Framework: Reliability pillardocs.aws.amazon.com
- Wikipedia: Little's lawen.wikipedia.org

Written by a software engineer and system architect with 10+ years of building production web, payment, ticketing and accounting systems in Japan and Nepal. About us