Load balancer vs reverse proxy: one door, two jobs
Load balancer vs reverse proxy: connection handling, Nginx algorithms, caching, failure modes, and verified simulation results.
In this lesson you will learn
- What a reverse proxy is, and what a load balancer does
- How a load balancer picks a server
- Layer 4 vs layer 7 load balancing
- Why caching at the proxy helps in a different way than adding servers
Builds on Lesson 13: DNS: from a name to an address 21 min read Next: Load balancing algorithms: round robin, least conn, hash

Drafted with AI assistance, then checked and edited by a human engineer · How we write
Short answer
A reverse proxy is a server that takes the client's request and makes its own request to your servers; load balancing (spreading requests over several servers) and caching are two jobs it can do. In our local simulation of 2,000 requests, one server took 10 s, round robin over 3 servers took 3,340.4 ms, and a caching proxy let only 424 requests reach a single server.
| Reverse proxy | Ends the client's connection and makes its own request upstream; the client only ever talks to the proxy |
|---|---|
| Load balancer | Picks which server handles each request or connection; it can work at L4 (TCP) or L7 (HTTP), and only the L7 kind is an HTTP reverse proxy |
| Our simulation, Run A and B | 2,000 requests, 30 clients, 20 ms per request: 1 server 10,000 ms (p50 140 ms); round robin over 3 servers 3,340.4 ms (p50 40.4 ms), split 667 / 667 / 666 |
| Our simulation, Run C | Caching proxy, 1 server: 424 of 2,000 reached the server, 1,576 cache hits (78.8%), p50 0.4 ms, p95 158 ms |
| Why the effects differ | Load balancing adds capacity for the same work; caching removes work, but only for repeated, cacheable responses |
| Cache stampede | 26 of the first 30 requests asked for /home before it was cached and all went to the server; Nginx proxy_cache_lock lets one fetch fill the cache while the rest wait, up to proxy_cache_lock_timeout (5 s by default) |
| Setup | Discrete event simulation on a virtual clock, seed 15, Node.js v22.13.1 on an Apple M2 Pro; a local simulation, not a benchmark |
Load balancer vs reverse proxy describes two overlapping roles, not two kinds of box. A reverse proxy is where the client's request ends: it accepts the connection and makes its own request to a server behind it. A load balancer is one decision: which of several servers gets each request or connection. An HTTP proxy such as Nginx usually does both, plus caching, while a packet-forwarding layer 4 balancer only does the second. This article goes through how Nginx implements each job, the algorithms, caching rules, failure modes, and a simulation of 2,000 requests that shows why spreading and caching help in very different ways.
Prerequisites
A request and a connection are different things. A browser opens a TCP connection (usually with TLS on top) and sends one or many HTTP requests over it. Some machines in front of your servers handle connections and packets; others read each HTTP request.
A server has a fixed capacity. If a server works on 4 requests at once and each takes 20 ms, it finishes at most 4 / 0.020 s = 200 requests per second. Anything above that waits in a queue, and near full use the wait grows much faster than the load. We built this intuition in fast for you, slow for a million and in ten lanes can still be slow, where more workers raised throughput but not the speed of one request.
Load balancer vs reverse proxy: definitions
Origin server (also backend or upstream): the server that actually produces the response, such as your application server running the code that builds a page.
Reverse proxy: a server that accepts the client's connection and request on behalf of one or more origin servers, makes its own separate request to an origin, and sends the answer back. The client only ever talks to the proxy.
Forward proxy: a proxy that acts for a group of clients, such as an office network, and fetches pages from any website on their behalf. Websites see the proxy's address instead of the user's.
Load balancer: a component that decides which of several equivalent servers receives each request or connection, so that load is spread and a failed server can be skipped.
Load balancing algorithm: the rule used to pick the server, for example round robin (each server in turn), least connections, or a hash of the client address or URL.
Shared cache: a cache that stores responses and reuses them for many different clients. A reverse proxy cache is a shared cache in the sense of RFC 9111, the HTTP caching standard.
TTL (time to live): how long a cached response counts as fresh. While it is fresh, the cache answers without asking the origin.
Cache stampede: many requests for the same missing or expired item arriving at once, all missing the cache together and all going to the origin.
How it works: what the door does to a request
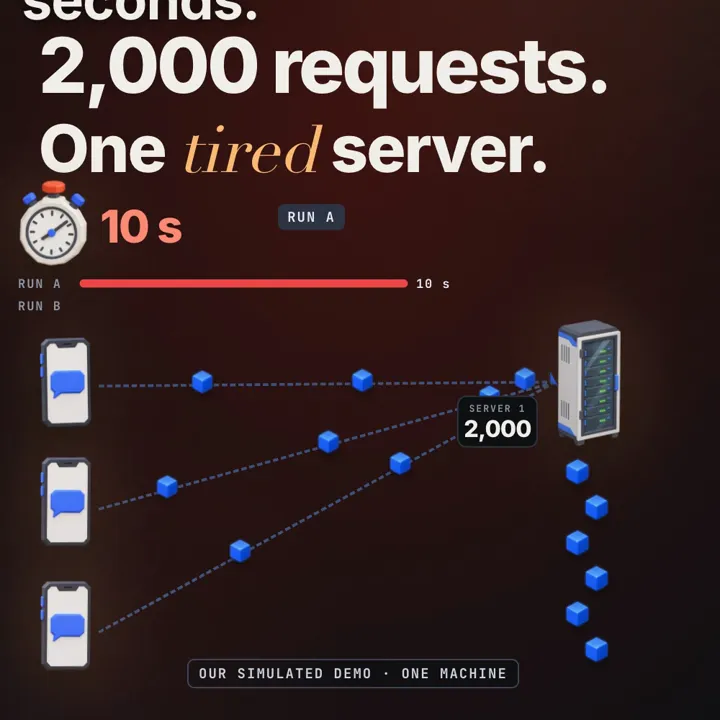
Without anything in front, DNS gives the client your server's address and the server does everything itself: TLS, slow clients, compression and the actual work. With a reverse proxy, DNS points at the proxy instead. Step by step, for one HTTP request:
- The client opens a TCP connection to the proxy and completes TLS with the proxy's certificate. The proxy has terminated the client connection: it ends here.
- The proxy reads the request: method, host, path, headers, cookies.
- It answers by itself (a cached copy, a redirect, a rate-limit refusal) or chooses an origin server.
- It sends a new request to that origin over a different connection, usually a reused keepalive one, adding
X-Forwarded-FororForwardedso the origin still learns the client's address. - It reads the origin's response, may cache it, and sends it to the client.
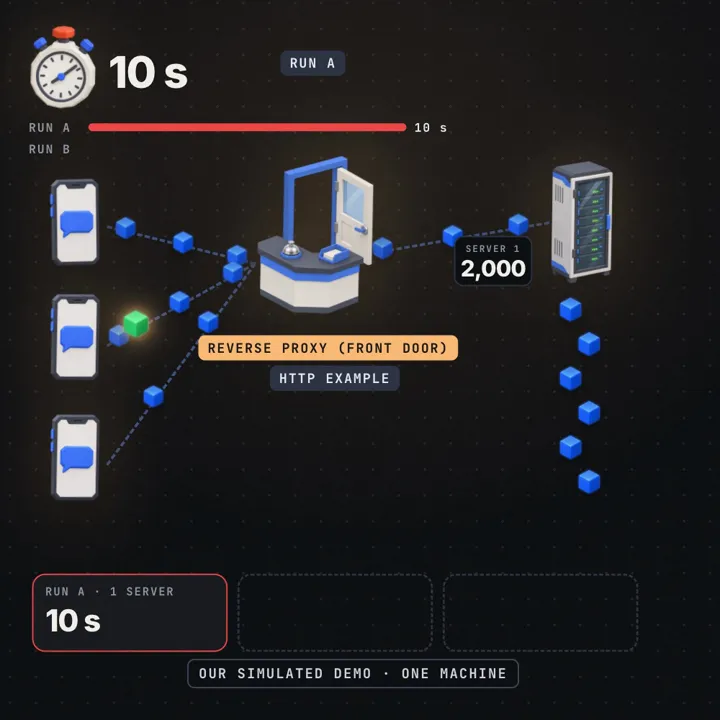
Because there are two separate connections, the proxy can do work in between, and how much it holds back depends on configuration. In Nginx:
- Request bodies are buffered by default. With
proxy_request_buffering onNginx reads the whole body before it connects upstream, keeping up toclient_body_buffer_size(8 KB or 16 KB by default, depending on the platform) in memory and spilling the rest to a temporary file. A 20 MB upload over a slow mobile link occupies an Nginx connection for seconds, but no origin worker. Withoff, bytes stream upstream as they arrive, and once Nginx has started sending the body it can no longer pass the request to another server. - Responses are buffered, but bounded and streamed. With
proxy_buffering onNginx reads the upstream response as fast as the origin sends it intoproxy_buffer_sizeplusproxy_buffers(default 8 buffers of 4 KB or 8 KB) and, if that fills, into a temporary file of up toproxy_max_temp_file_size(1024 MB by default). It sends to the client at the same time; it does not wait for the full response. The origin is released as soon as the response is read, while a slow client drains Nginx's copy. - Streaming (server-sent events, long polling, chunked progress output) needs
proxy_buffering offfor that location, or the origin sendsX-Accel-Buffering: noper response. Nginx then passes data on as it is received, using a singleproxy_buffer_sizebuffer at a time. - Retries end at the first byte.
proxy_next_upstreamcan move a request to another server only if nothing has been sent to the client yet. An origin that fails halfway through a response produces a truncated response, not a retry.
Nginx, HAProxy, Envoy, Caddy and cloud HTTP load balancers are all reverse proxies; a CDN is many caching reverse proxies placed near users.
Inside Nginx: workers, peers, connections, cache
Worker event loops. The master process reads the configuration and forks worker_processes workers (usually one per core). Each worker is a single-threaded, non-blocking event loop on epoll (Linux) or kqueue (BSD, macOS), multiplexing thousands of client and upstream sockets. A request lives entirely in one worker: it accepts the client connection, picks the upstream peer, opens or reuses the upstream connection, and relays the bytes. Nothing blocks except disk I/O, which is why cache files and temp files matter (see aio and thread_pool for offloading).
Upstream peer selection and shared state. Round robin is a smooth weighted round robin (ngx_http_upstream_round_robin.c): on each pick every peer adds its weight to a running current_weight, the peer with the largest value wins, and the winner subtracts the total weight. With weights 5, 1, 1 that yields a, a, b, a, c, a, a rather than five a's in a row. Peer state (current weights, active connection counts, failure counters for max_fails) lives in each worker's own memory unless the upstream block has a zone, which moves the group's configuration and run-time state into shared memory used by all workers. Without a zone, 4 workers run 4 independent round robins and 4 independent failure counts, so a dead server can take up to max_fails failures in each worker before every worker marks it down.
Connection reuse. keepalive sets the maximum number of idle upstream connections cached per worker; it does not limit active connections. With 4 workers and keepalive 32, up to 4 × 32 = 128 idle connections are cached across the 3 servers, in addition to whatever is active at that moment. Size the origin's connection limit for active plus idle: an app server with a 100-connection cap behind that pool can be filled by idle sockets alone. Beyond the cache size the least recently used idle connections are closed. The configuration below explicitly enables HTTP/1.1 reuse with proxy_http_version 1.1 and an empty Connection header; current NGINX documentation also covers HTTP/2 upstream connections and notes defaults that changed in 1.29.7, so check the docs for the version you run. We wrote the configuration against the nginx.org documentation for the 1.28 stable and 1.29 mainline lines; it was not run in our lab. keepalive_requests (1000 by default) and keepalive_timeout (60 s) recycle connections. Without reuse, each new TCP connection normally adds a handshake; the active closer generally incurs TIME_WAIT.
Cache metadata versus disk storage. proxy_cache_path ... keys_zone=site:10m puts the cache index in shared memory: keys, validity times, usage counters. The Nginx docs size this at about 8,000 keys per megabyte, so 10 MB indexes roughly 80,000 responses. The response bodies are files on disk, named by the MD5 of the cache key and spread over directories by levels=1:2 (for example /var/cache/nginx/site/c/29/b7f54b2df7773722d382f4809d65029c). A separate cache manager process evicts least recently used files when max_size is exceeded or an item has not been accessed for inactive; a cache loader process rebuilds the index from disk after a restart. If the keys zone fills before the disk does, Nginx evicts entries early, so watch both.
Where the time goes. Nginx exposes four timers per request that split a slow response into its causes (upstream variables):
| Variable | Measures | High value usually means |
|---|---|---|
$upstream_connect_time | Time to establish the upstream connection (and TLS, if any) | Origin accept queue full, network loss, no connection reuse |
$upstream_header_time | Connect plus time until the response headers arrived | Origin processing: queueing in the app, slow database |
$upstream_response_time | Until the last byte of the response body came from the origin | Large or slowly generated bodies |
$request_time | From the first client byte read to the log write after the last byte sent | If much larger than $upstream_response_time: slow client upload or download |
Subtracting gives diagnostic approximations, not exact attribution, and only for a single upstream attempt. Header time minus connect time approximates origin think time, but it also includes sending the request and network transfer. Request time minus upstream response time approximates client side time (reading a buffered upload before the upstream request, or draining a buffered response to a slow phone), but it also includes proxy overhead, and the stages can overlap because Nginx sends to the client while still reading from the origin. Do not subtract directly for retried requests, cache hits (no upstream values) or streamed responses. When a request was retried, the upstream variables hold a comma separated list, one value per server tried, which is itself a signal worth alerting on.
How a load balancer picks a server
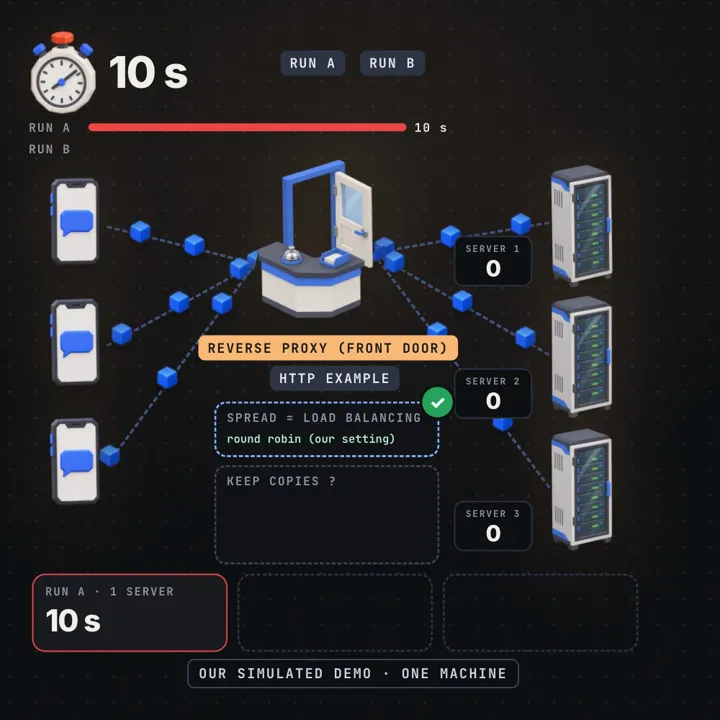
With several origins the proxy needs a rule, and the choice matters most when requests or servers differ in size.
| Method | How it picks | Good when | Weak when |
|---|---|---|---|
| Round robin | Next server in a fixed cycle | Requests cost about the same, servers are identical | Some requests are 100× heavier than others |
| Weighted round robin | Cycle where a server with weight 2 gets twice the turns | Servers of different sizes | Weights go stale as load changes |
| Least connections | Server with the fewest active upstream connections (weighted) | Request durations vary a lot (uploads, reports) | Many proxies or workers each see only their own counts; multiplexed protocols |
| IP hash | Hash of the client address picks the server | You need the same client on the same server (sticky sessions) | Many users behind one NAT all land on one server |
| Consistent hashing | Hash of a key (URL, user ID) on a ring; adding a server moves only about 1/N of keys | Per-server caches, sharded data | Hot keys still land on one server |
Round robin is the Nginx default. It worked perfectly in our simulation because every request cost exactly 20 ms on identical servers, so the split came out 667 / 667 / 666. With real, lumpy traffic, one heavy export can sit on a server while round robin keeps handing it work. least_conn instead uses active upstream connections as a stand-in for load: it picks the server with the fewest, adjusted by weight, and breaks ties with weighted round robin. It never sees the application's queue, CPU or memory. The stand-in holds up when each proxied request holds exactly one upstream connection for its whole life (HTTP/1.1 to the origin, no pipelining), because then active connections equal outstanding requests from this proxy. It weakens when:
- Request costs differ but durations do not reveal it yet. A just-started 2 s report and a just-started 5 ms lookup each count as one connection.
- Connections are multiplexed or long-lived. Over gRPC or HTTP/2 to the origin, or with WebSockets, one connection can carry many requests or sit idle for hours; the count stops tracking work.
- Counts are partial. Without a
zone, each Nginx worker counts only its own connections, so with 4 workers each sees about a quarter of the picture; with several proxy machines, each sees only its own traffic. Addzone app 64k;to share counts across workers, and expect machines to stay independent.
Hash methods trade evenness for locality: with plain hash(key) mod N, adding a fourth server moves about three quarters of the keys, while consistent hashing (hash $request_uri consistent;) moves about a quarter. Part 16, "Which server gets your request?", goes through these methods one by one.
Health checks decide which servers are in the rotation. Passive checks watch real traffic: open-source Nginx skips a server after max_fails failures within fail_timeout (defaults 1 and 10 seconds). Active checks probe something like GET /healthz every few seconds; HAProxy, Envoy, cloud load balancers and NGINX Plus have them. Health checks are what make several copies a real parallel group, as in two servers in a row fail twice as often as one: a copy only helps if broken ones stop getting traffic.
Layer 4 vs layer 7: when a load balancer is not a proxy
Layer 4 is transport (TCP and UDP connections). Layer 7 is the application protocol (HTTP: paths, headers, cookies).
A layer 7 load balancer is an HTTP reverse proxy. It terminates the connection, reads every request, and can route /api/ to one pool and /images/ to another, retry, cache and compress. It can also spread the requests of one long-lived HTTP/2 connection over many servers. The cost is parsing and often TLS work for every request.
A layer 4 load balancer picks a server when a connection (or UDP flow) starts and then forwards that connection's bytes. What it can see depends on the kind:
- Packet forwarders terminate nothing. Linux IPVS rewrites packet addresses (NAT) or forwards packets so the server replies straight to the client (direct server return). They decide from addresses, ports and protocol, typically a hash of the 5-tuple or a per-connection table.
- TCP proxies such as Nginx's
streammodule and HAProxy in TCP mode terminate TCP and open their own connection to the server. They can also peek at the first bytes without terminating TLS:ssl_prereadreads the unencrypted TLS ClientHello and exposes the SNI host name ($ssl_preread_server_name) and ALPN protocols, so the proxy can routeapi.example.comandwww.example.comto different pools while the TLS session stays end to end.
Neither kind processes HTTP. Routing by path, header or cookie, caching a response, or answering for the server all need the decrypted HTTP request, which only a layer 7 proxy has. In that sense a layer 4 balancer is not an HTTP reverse proxy.
This answers the title question. "Reverse proxy" describes where the request ends and who makes the next request. "Load balancer" describes one decision: which server. An HTTP reverse proxy with several origins is both. A packet-forwarding layer 4 balancer is only the second. A reverse proxy in front of one server is only the first.
A typical large design stacks them: a layer 4 tier spreads connections over layer 7 proxies, which spread requests over application servers.
TLS termination follows the same line. A proxy that holds the certificate decrypts traffic and can do layer 7 work, then sends plain HTTP on a private network or re-encrypts to the origin. A balancer that passes TLS through (often routing on the SNI host name read from the ClientHello) stays at layer 4, and the origins hold the certificates.
Caching at the proxy
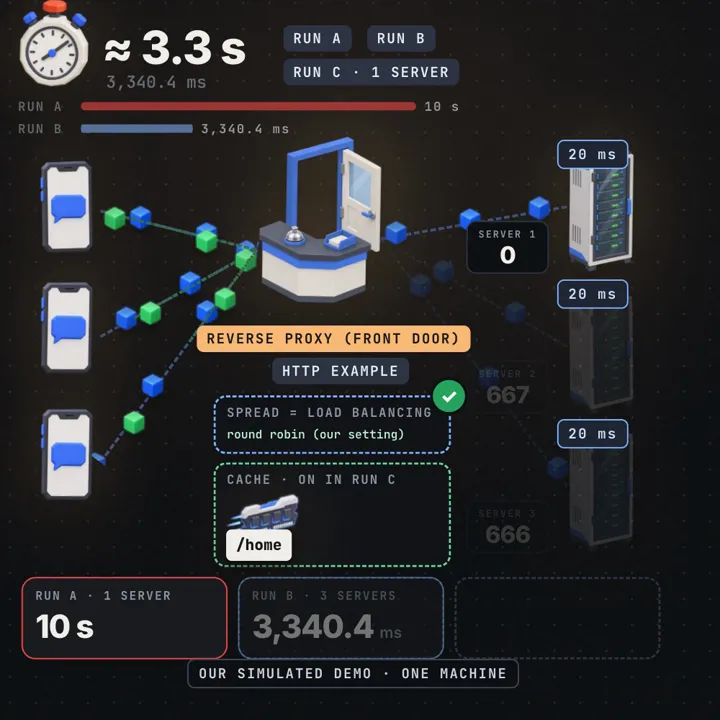
A caching reverse proxy stores responses and answers later requests itself while the stored copy is fresh. Four rules decide what happens.
What may be stored. Under RFC 9111 the origin says so in Cache-Control: max-age=60 is fresh for 60 seconds in any cache, s-maxage applies only to shared caches, private forbids shared caches, no-store forbids storing, and no-cache means revalidate before every reuse. Nginx applies its own precedence (cache validity rules):
X-Accel-Expiresfrom the origin wins: a number of seconds,0to disable caching, or@plus an absolute Unix time.- Otherwise
Cache-ControlandExpires. Nginx usesmax-ageands-maxagefor the lifetime, and treatsprivate,no-storeandno-cacheas "do not cache" (stricter than RFC 9111, whereno-cacheallows storing with revalidation). A response with onlyCache-Control: publicand no lifetime gives no time, so the next rule applies. - Only when none of these set a lifetime does
proxy_cache_validapply.
On top of that, a response with Set-Cookie is not cached, Vary: * is not cached, other Vary values make the listed request headers part of the match, and proxy_ignore_headers can switch any of these header rules off. Only GET and HEAD are cached by default (proxy_cache_methods).
The cache key. Two requests share a stored response only if their keys match; the Nginx default is $scheme$proxy_host$request_uri. If a page differs per user or language and the key ignores that, one user's page reaches another. The Vary header names request headers that must also match.
Freshness lifetime versus stale lifetime. The TTL is the freshness lifetime: how long the cache may answer without contacting the origin. A short TTL keeps content current; a long one removes more work. Our TTL was 5,000 ms and the cached run lasted 2,120.4 ms, so /home never expired. The stale lifetime is a separate budget: how long after expiry the cache may still serve the old copy. proxy_cache_use_stale has no age limit. With updating, a stale copy is served for as long as a refresh is in flight; with error timeout http_502 http_503, it is served for as long as the origin keeps failing, which can be hours. Items that keep being requested are never removed by inactive. So the configuration below can serve a page far older than 5 seconds. "At most one TTL old" holds only with stale serving switched off.
Stampede and coalescing. A key is missing at the start and briefly after each expiry, and every client that asks in that window goes to the origin. Our lab had no protection: 26 of the first 30 requests were for /home, all arrived before the first response came back, and all 26 reached the server. On a busy site this repeats for a popular page every time its TTL runs out. The fixes:
- Request coalescing: the first miss fetches and the others wait for its result. In Nginx,
proxy_cache_lock on;lets one request at a time fill a new cache element while the rest wait, with two escape conditions (cache locks). Afterproxy_cache_lock_timeout(default 5 seconds) a waiter is passed to the origin, and its response is not cached. Afterproxy_cache_lock_age(default 5 seconds) without the first request finishing, one more request may go to the origin to fill the cache. Set both above your slow origin latency, for exampleproxy_cache_lock_timeout 10s; proxy_cache_lock_age 10s;for an origin whose p99 is 3 s, or a slow origin turns the lock back into a stampede five seconds in. Watch for it asMISSbursts in$upstream_cache_statusfor one key. - Serve stale while refreshing:
proxy_cache_use_stale updating;withproxy_cache_background_update on;answers from the expired copy while one background request refreshes it. - Serve stale on error:
proxy_cache_use_stale error timeout http_502 http_503keeps old pages up when the origin fails, with no upper bound on their age. - Bounded staleness: if freshness is a requirement, leave
proxy_cache_use_staleat its defaultoffand have the origin sendCache-Control: public, max-age=5, stale-while-revalidate=5, stale-if-error=60. Nginx honours these extensions (proxy_cache_use_stale), so a response is at most 5 + 5 = 10 seconds old while refreshing and at most 5 + 60 = 65 seconds old during an origin outage, after which clients get the error instead. The directive's parameters take priority over these extensions, which is why they must not be set too. For a strict 5 second bound, sendmax-age=5alone: every request after expiry waits for the origin.
Why spreading and caching help differently
Load balancing adds capacity. Each request still costs 20 ms, but three servers finish 3 × 200 = 600 requests per second instead of 200. The total work is unchanged (2,000 × 20 ms = 40,000 ms of server time); each queue is shorter.
Caching removes work. A hit costs the origin nothing. In Run C the server handled 424 requests, 424 × 20 ms = 8,480 ms of work, which takes one 4-slot server 8,480 / 4 = 2,120 ms. The run took 2,120.4 ms, so the server was busy the entire time, just with less to do.
Utilisation is the share of capacity in use: ρ = λ / μ, arrival rate over service rate. In Run A the clients send as fast as answers return, so the server runs at 100% for 10 seconds and the queue holds 30 minus 4 in service, the 26 the lab recorded as the maximum queue. In Run B each server has about 10 clients' requests, 4 in service and 6 waiting, matching the recorded maximum of 6.
Little's law ties these together: L = λW. The long-run average number of requests in the system (L) equals throughput (λ) times average time inside (W), for any stable system. Our clients keep 30 requests in flight while work remains, so in steady state L = 30 and throughput alone estimates the mean response time. A finite run is not fully steady: at the end it drains, the last requests finish with fewer than 30 in flight, so the true average concurrency is a little below 30 and the measured mean comes out a little below the estimate:
Little's law, steady state: W ≈ L / λ        L = 30 requests in flight

Run A  λ = 2,000 / 10.0000 s = 200.0 req/s    W ≈ 30 / 200.0 = 150.0 ms   measured mean 149.02 ms
Run B  λ = 2,000 /  3.3404 s ≈ 598.7 req/s    W ≈ 30 / 598.7 ≈  50.1 ms   measured mean 49.786 ms
Run C  λ = 2,000 /  2.1204 s ≈ 943.2 req/s    W ≈ 30 / 943.2 ≈  31.8 ms   measured mean 30.8298 ms
The measured means come from the Python port below, which prints sum(lat) / len(lat). Run C's mean of about 31 ms describes almost no request: hits take 0.4 ms (two hops of 0.2 ms) and misses around 150 ms, and 0.212 × 150 ≈ 31.8. A mean need not lie between any two percentiles; in a bimodal distribution like this one it can sit far from every real request. That is why we report percentiles.
It is also why Run C's p95 stayed at 158 ms, close to Run A's 160 ms. Misses were 424 of 2,000, or 21.2%, more than the slowest 5%, so the p95 is a miss, and a miss waits in the same queue as Run A: one server, up to 26 waiting. Caching made the typical request almost free and left the slow ones as slow as before. To fix the tail you need both jobs, a cache to remove repeated work and enough servers that the remaining misses do not queue. The database layer has the same split: in one database writes, ten read, replicas add read capacity where a cache would remove reads.
Worked example
The video replays the same 2,000 requests in three runs. We simulated them with a discrete event simulation on a virtual clock (labs/sd-15/run.mjs, seed 15), run locally with Node.js v22.13.1 on an Apple M2 Pro. The clock is virtual, so machine speed does not change the numbers. This is a local simulation, not a benchmark.
assumed parameters (simulation, not production)
  30 concurrent clients, each sends its next request when the last one returns
  backend: 20 ms of work per request, 4 at a time, the rest wait in FIFO order
  0.2 ms per extra hop through the load balancer or proxy
  workload: 2,000 requests, 80% for /home (1,602 in this seed), the rest unique article pages
  cache TTL 5,000 ms, no request coalescing

capacity of one server = 4 / 20 ms = 200 req/s

Run A  direct, 1 server
  2,000 / 4 = 500 rounds × 20 ms = 10,000 ms           measured 10,000 ms
  p50 140 ms, p95 160 ms

Run B  round robin over 3 servers
  split 667 / 667 / 666
  busiest server: ceil(667 / 4) × 20 = 3,340 ms; plus 0.4 ms of simulated hops = 3,340.4 ms   measured 3,340.4 ms
  p50 40.4 ms, p95 60 ms
  speed-up 10,000 / 3,340.4 ≈ 3.0×, each request still 20 ms of work

Run C  caching reverse proxy, 1 server
  misses = 398 unique article pages + 26 /home stampede = 424   (reached the server)
  hits   = 1,602 /home minus 26 = 1,576                              (78.8% of 2,000)
  server work: 424 × 20 ms / 4 = 2,120 ms                        measured 2,120.4 ms
  p50 0.4 ms (a hit), p95 158 ms (a miss in the queue)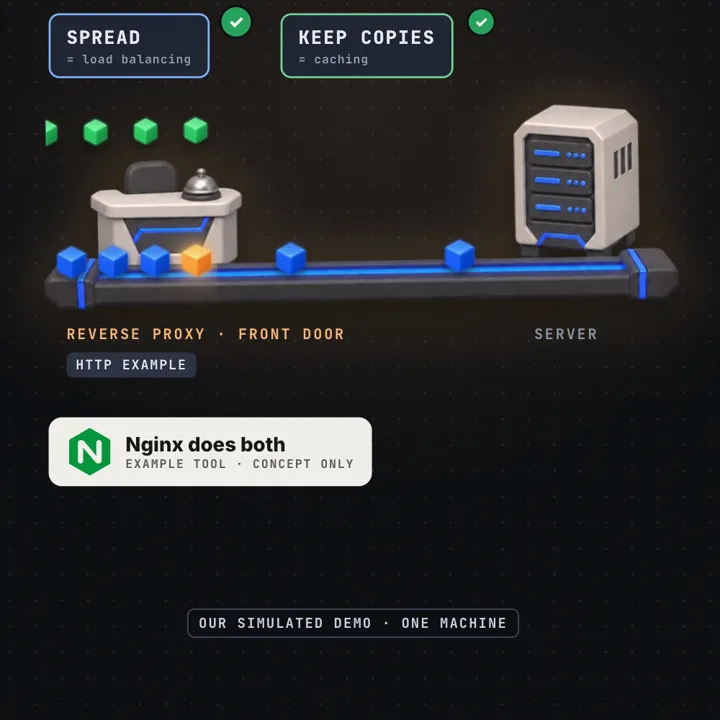
State the limits out loud: service time is exactly 20 ms, there is no network or TLS, and the hits depend on 80% of requests asking for one page.
Code
First, the configuration. This Nginx server block does all three jobs from the article: TLS termination, round robin over three servers with passive health checks, and a cache with stampede protection. Addresses and paths are examples; assume worker_processes 4; in nginx.conf.
# /etc/nginx/conf.d/site.conf
# bodies on disk; index in shared memory (10 MB is about 80,000 keys)
proxy_cache_path /var/cache/nginx/site levels=1:2 keys_zone=site:10m
                 max_size=1g inactive=10m use_temp_path=off;

# split slow responses into connect, origin and client time
log_format timing '$remote_addr "$request" $status rt=$request_time '
                  'uct=$upstream_connect_time uht=$upstream_header_time '
                  'urt=$upstream_response_time cache=$upstream_cache_status';

upstream app {
    zone app 64k;                      # share peer state across all 4 workers
    # round robin is the default; uncomment ONE line to change the method
    # least_conn;
    # ip_hash;
    # hash $request_uri consistent;
    server 10.0.0.11:8080 max_fails=3 fail_timeout=10s;
    server 10.0.0.12:8080 max_fails=3 fail_timeout=10s;
    server 10.0.0.13:8080 max_fails=3 fail_timeout=10s;
    keepalive 32;                      # idle connections cached PER WORKER: 4 x 32 = 128
}

server {
    access_log /var/log/nginx/site.timing.log timing;
    listen 443 ssl;                    # TLS ends here
    server_name example.com;
    ssl_certificate     /etc/nginx/tls/example.com.crt;
    ssl_certificate_key /etc/nginx/tls/example.com.key;

    location / {
        proxy_pass http://app;         # a new request to one server in the group
        proxy_http_version 1.1;
        proxy_set_header Connection "";
        proxy_set_header Host $host;
        proxy_set_header X-Forwarded-For $proxy_add_x_forwarded_for;
        proxy_set_header X-Forwarded-Proto $scheme;
        proxy_next_upstream error timeout http_502 http_503;

        proxy_cache site;
        proxy_cache_key $scheme$host$request_uri;
        proxy_cache_valid 200 5s;      # only if no X-Accel-Expires, Cache-Control or Expires lifetime
        # session isolation: logged-in or authorised requests never read or write the cache
        proxy_cache_bypass $http_cookie $http_authorization;   # do not READ: skip any stored copy
        proxy_no_cache     $http_cookie $http_authorization;   # do not STORE: keep this response out
        proxy_cache_lock on;           # one miss fetches, the rest wait...
        proxy_cache_lock_timeout 10s;  # ...until 10s, then waiters go upstream uncached
        proxy_cache_lock_age 10s;      # a fill running longer than 10s lets one more request through
        # availability over freshness: stale age is UNBOUNDED while updating or failing
        proxy_cache_use_stale error timeout updating http_502 http_503;
        proxy_cache_background_update on;
        add_header X-Cache-Status $upstream_cache_status always;
    }

    # cache demo against a public endpoint: Cache-Control: public, max-age=5, no Set-Cookie
    location /demo/ {
        proxy_pass https://httpbin.org/;   # /demo/cache/5 -> https://httpbin.org/cache/5
        proxy_set_header Host httpbin.org;
        proxy_ssl_server_name on;          # SNI picks the host name; it does not authenticate
        proxy_ssl_verify on;               # verify the upstream certificate (default is off)
        proxy_ssl_trusted_certificate /etc/ssl/certs/ca-certificates.crt;   # your CA bundle
        proxy_ssl_verify_depth 2;          # leaf plus intermediate; the default of 1 can reject real chains
        proxy_cache site;
        add_header X-Cache-Status $upstream_cache_status always;
    }
}
Two cache directives in location / do different jobs. proxy_cache_bypass controls reading: a request with any cookie or Authorization header skips the stored copy and goes to the origin. proxy_no_cache controls storing: that request's response is never written to the cache. You need both, because Set-Cookie on a response only stops storing; without the bypass, a logged-in user could still be served a copy cached from an anonymous request. If the site sets an analytics cookie on everyone, the bypass on $http_cookie disables caching for everyone, so either key on the session cookie ($cookie_session) or restrict proxy_cache to explicitly public locations. The lock settings are tied to origin latency: with a p99 of about 3 s, 10 s keeps waiters waiting through a normal slow fill.
proxy_ssl_server_name on sends SNI so the origin picks the right certificate; it does not prove who answered. proxy_ssl_verify on with a trusted CA bundle does that, and without it anyone on the path to the origin could present any certificate. The bundle path shown is the Debian and Ubuntu one; use your deployment's.
What to observe: https://httpbin.org/cache/5 answers with Cache-Control: public, max-age=5 and no Set-Cookie, so its freshness is explicitly 5 seconds. Run curl -sI https://example.com/demo/cache/5 twice within 5 seconds; X-Cache-Status says MISS, then HIT. Wait more than 5 seconds and the next request says EXPIRED: the demo location has no stale serving, so Nginx refetched. The same test against / on your own app works only if the app response is cacheable by the rules above; if it sets a cookie or sends private, you see MISS every time. Stop one app server and requests keep working, because Nginx retries the next server and skips the dead one. In site.timing.log, a retried request shows two comma separated values in uct and urt.
Second, a standard-library Python port of our lab. It uses the same seeded generator, so it replays the same 2,000 requests, then runs Run C again with request coalescing.
# door_lab.py: one server, a round-robin load balancer, a caching reverse proxy
# Discrete event simulation on a virtual clock. Standard library only.
import heapq, itertools, math

SERVICE, SLOTS, HOP, TTL = 20.0, 4, 0.2, 5000.0   # ms, requests at once, ms, ms
CLIENTS, N, HOT = 30, 2000, "/home"

def mulberry32(a):                     # same seeded generator as labs/sd-15/run.mjs
    def nxt():
        nonlocal a
        a = (a + 0x6D2B79F5) & 0xFFFFFFFF
        t = ((a ^ (a >> 15)) * (1 | a)) & 0xFFFFFFFF
        t = ((t + (((t ^ (t >> 7)) * (61 | t)) & 0xFFFFFFFF)) & 0xFFFFFFFF) ^ t
        return ((t ^ (t >> 14)) & 0xFFFFFFFF) / 4294967296
    return nxt

rng = mulberry32(15)
WORK = [HOT if rng() < 0.8 else f"/article/{i}" for i in range(N)]

class Sim:
    def __init__(self): self.now, self.q, self.seq = 0.0, [], itertools.count()
    def after(self, d, fn): heapq.heappush(self.q, (self.now + d, next(self.seq), fn))
    def run(self):
        while self.q:
            self.now, _, fn = heapq.heappop(self.q); fn()

class Server:                          # SLOTS at a time, the rest wait in FIFO order
    def __init__(self, sim): self.sim, self.busy, self.wait, self.got = sim, 0, [], 0
    def handle(self, done):
        self.got += 1
        if self.busy < SLOTS: self.start(done)
        else: self.wait.append(done)
    def start(self, done):
        self.busy += 1
        def finish():
            self.busy -= 1
            if self.wait: self.start(self.wait.pop(0))
            done()
        self.sim.after(SERVICE, finish)

def run(setup, coalesce=False):
    sim = Sim()
    servers = [Server(sim) for _ in range(3 if setup == "B" else 1)]
    rr, cache, waiting, stats = itertools.cycle(servers), {}, {}, {"hit": 0, "miss": 0}

    def send(path, done):
        if setup == "A":
            return servers[0].handle(done)
        if setup == "B":
            s = next(rr)
            return sim.after(HOP, lambda: s.handle(lambda: sim.after(HOP, done)))
        def at_proxy():                # setup C: answer from cache when fresh
            if cache.get(path, -1) > sim.now:
                stats["hit"] += 1
                return sim.after(HOP, done)
            if coalesce and path in waiting:      # join the fetch already in flight
                stats["hit"] += 1
                return waiting[path].append(done)
            stats["miss"] += 1
            group = [done]
            if coalesce: waiting[path] = group
            def filled():
                cache[path] = sim.now + TTL
                waiting.pop(path, None)
                for d in group: sim.after(HOP, d)
            servers[0].handle(filled)
        sim.after(HOP, at_proxy)

    lat, it, end = [], iter(WORK), [0.0]
    def client():
        path = next(it, None)
        if path is None: return
        t0 = sim.now
        def done():
            lat.append(sim.now - t0); end[0] = sim.now; client()
        send(path, done)
    for _ in range(CLIENTS): client()
    sim.run()
    lat.sort()
    pct = lambda p: round(lat[max(0, math.ceil(p / 100 * len(lat)) - 1)], 1)
    print(f"{setup}{' + coalescing' if coalesce else '':14} total {round(end[0], 1):>7} ms  "
          f"p50 {pct(50):>5}  p95 {pct(95):>5}  per server {[s.got for s in servers]}"
          + (f"  cache hits {stats['hit']}" if setup == "C" else ""))
    return round(sum(lat) / len(lat), 4), end[0]

results = {s: run(s) for s in "ABC"}
run("C", coalesce=True)
for s, (mean, total) in results.items():   # measured mean vs Little's law at steady state
    print(f"{s} mean {mean} ms, steady-state estimate 30 / throughput = {30 * total / N:.1f} ms")
Run it with python3 door_lab.py (we used Python 3.14). It prints:
A               total 10000.0 ms  p50 140.0  p95 160.0  per server [2000]
B               total  3340.4 ms  p50  40.4  p95  60.0  per server [667, 667, 666]
C               total  2120.4 ms  p50   0.4  p95 158.0  per server [424]  cache hits 1576
C + coalescing  total  2000.8 ms  p50   0.4  p95 157.6  per server [399]  cache hits 1601
A mean 149.02 ms, steady-state estimate 30 / throughput = 150.0 ms
B mean 49.786 ms, steady-state estimate 30 / throughput = 50.1 ms
C mean 30.8298 ms, steady-state estimate 30 / throughput = 31.8 ms
What to observe: the first three lines match the Node.js lab exactly. The measured means sit just under the Little's law estimates because each run drains at the end: once the 2,000th request is sent, fewer than 30 are in flight. With coalescing, the 26 stampede misses become 1 fetch plus 25 waiters, so the server receives 399 requests (1 for /home plus the 398 unique article pages); the line counts the 25 waiters as served from the cache. The model's waiters wait without limit; real Nginx releases them after proxy_cache_lock_timeout and lets another fill through after proxy_cache_lock_age, which only matters when a fill takes longer than those settings. The p95 barely moves, because the 398 article pages are still misses. Try SLOTS = 8 and watch A halve; set the hot share to 0.2 and watch the cache stop helping.
Failure modes and edge cases
The door is a single point of failure. Every request passes through the proxy, so it sits in series with everything behind it. Run at least two, behind a floating IP, a layer 4 tier or several DNS records; 99.9% still means 8.76 hours down a year, and proxy downtime counts in full.
Health checks that miss real failures. A server that answers /healthz with 200 but fails real requests stays in the rotation, while a check that also tests the database can remove every server at once when it blips. Alert when the healthy count drops.
Retries that double the load. proxy_next_upstream retries on another server, so a slow request that times out on server 1 is done twice. Nginx does not retry a POST that was already sent unless you allow it; keep that default unless the endpoint is idempotent.
Caching private pages. A cookie-dependent response cached under a key without the cookie shows one user's account page to the next. Send Cache-Control: private for personal pages and test with two logged-in users.
Stampede on expiry. Without coalescing, a hot key sends a burst of misses to the origin every TTL, visible as periodic spikes in origin traffic. Turn on proxy_cache_lock with a timeout and lock age above the origin's slow latency, and serve stale while updating.
Lost client address. The origin sees the proxy's address, so rate limits treat all users as one. Pass X-Forwarded-For and trust it only from the proxy, or anyone can forge it.
Sticky sessions that pile up. IP hash sends a whole office or carrier NAT to one server. Keep sessions in a shared store so any server can answer, like the stateless app servers in 50K fans, 5K seats.
Trade-offs
| Option | Good for | Costs you | Use when |
|---|---|---|---|
| Clients straight to one server | Simplicity, lowest latency at low load | No failover, the server handles TLS and slow clients itself | Prototypes and internal tools |
| Reverse proxy, one origin | TLS termination, buffering, compression, hiding the origin | One extra hop and a component to run | Almost always, even with one server |
| Layer 7 load balancing | Routing by path or host, per-request spreading, retries | Per-request CPU and TLS work at the proxy | HTTP services with several stateless servers |
| Layer 4 load balancing | Very high connection rates, any TCP or UDP protocol | No view of paths or cookies, no caching | In front of a layer 7 tier, databases, non-HTTP traffic |
| Caching at the proxy | Repeated public responses | Stale data within the TTL plus any stale budget, key design, invalidation | Many users ask for the same response |
| CDN (many caching proxies near users) | Static files and public pages worldwide | Cost, purge delays, less control | Users far from your servers or traffic spikes |
Common mistakes
In an interview
- Clarify: is the traffic HTTP? How many servers? Are responses the same for many users or personal?
- Assumptions: state a per-server capacity (for example 200 requests per second) and a peak load; say what share of requests repeat.
- Structure: draw the path: DNS, a pair of reverse proxies, a server pool, the database. Mark where TLS ends.
- Deep dive: pick an algorithm (round robin for equal requests, least connections for uneven ones), describe health checks, then the cache: key, TTL,
Cache-Control, stampede protection. - Trade-offs: layer 4 for raw connection volume, layer 7 for routing and caching; caching removes work but serves data up to one TTL old, and longer if stale serving is on, so state the freshness lifetime and the stale budget separately.
- Wrap up: spreading adds capacity, caching removes work, and you usually want both, with the proxies themselves redundant.
A reverse proxy sits in front of my servers, ends the client's connection and makes its own request to a backend. Load balancing is one decision it can make: which backend gets this request. Nginx with an upstream group is a reverse proxy doing load balancing; a layer 4 balancer that only forwards TCP packets balances load without being an HTTP proxy. The jobs help differently: three servers triple capacity but each request costs the same work, while a cache removes work for repeated responses and does nothing for misses. I would run a redundant pair of proxies, terminate TLS there, use least connections with health checks, cache public pages with a short TTL and request coalescing, and size the pool so misses do not queue.
Practice
BeginnerWhat does it mean that a reverse proxy terminates the client connection?
The client's TCP and TLS connection ends at the proxy. The proxy reads the request and makes a separate request to a backend over a different connection.
IntermediateA server handles 4 requests at once at 20 ms each. What is its maximum throughput, and how long do 2,000 requests take at full load?
4 / 0.020 s = 200 requests per second, so 2,000 / 200 = 10 s. That is Run A.
IntermediateSome requests take 5 ms and some take 2 s. Which algorithm, and why?
Least connections. Round robin keeps feeding a server that is stuck on slow requests; least connections uses active upstream connections as a load proxy, and a server busy with 2 s requests holds more of them. It works best with one request per upstream connection and a shared zone so all workers see the same counts.
IntermediateCan a layer 4 load balancer cache an HTTP response?
No. A packet forwarder sees only addresses and ports; a TCP proxy can also read TLS ClientHello metadata such as SNI, but not the encrypted path or headers. Without the HTTP request and response it cannot build a cache key or store a response. Caching needs a layer 7 proxy that processes HTTP.
AdvancedA system keeps 30 requests in flight and completes 600 per second. What is the mean response time?
Little's law in steady state: W = L / λ = 30 / 600 = 0.05 s = 50 ms. Run B was close to this: 2,000 requests in 3,340.4 ms is about 598.7 per second, an estimate of about 50.1 ms; the measured mean was 49.786 ms because the run drains at the end with fewer than 30 in flight.
Advanced78.8% of requests were cache hits, yet the p95 barely changed. Why?
The 21.2% that missed is more than 5% of requests, so the p95 is a miss, and misses still queue at one server. Add backend capacity or raise the hit rate above 95% to move the tail.
AdvancedYou add a fourth server to a pool that uses hash(URL) mod N for per-server caches. What happens, and what is the fix?
About three quarters of URLs change server, so most local caches go cold at once and the origin load jumps. Consistent hashing moves only about 1/4 of keys.
Cheat sheet
| Term or formula | Meaning |
|---|---|
| Reverse proxy | Ends the client connection, makes its own request upstream, answers for the servers |
| Forward proxy | Acts for clients; websites see the proxy instead of the user |
| Load balancer | Chooses which server gets each request or connection |
| Layer 4 vs layer 7 | Connections (plus SNI via TLS preread) vs full HTTP requests; only layer 7 can route by path or cache |
| Round robin, least connections, hash | Each in turn; fewest active upstream connections; same key to the same server |
| Health check | Passive (watch real failures) or active (probe); removes broken servers |
| TLS termination | The proxy holds the certificate and decrypts traffic |
| Cache-Control, TTL, cache key | What may be stored, for how long, and which requests share it |
| Stampede and coalescing | Many misses at once vs one fetch while the rest wait (proxy_cache_lock) |
| Capacity: slots / service time | 4 / 20 ms = 200 requests per second per server |
| Utilisation ρ = λ / μ | Share of capacity in use; queues grow sharply near 1 |
| Little's law L = λW | In flight = throughput × time in system; steady state 30 = 200/s × 150 ms (Run A measured 149.02 ms after draining) |
Further reading
- NGINX docs, Using nginx as HTTP load balancer: the upstream block, round robin, least_conn, ip_hash, weights and passive health checks.
- NGINX admin guide, Reverse Proxy: proxy_pass, passing headers, buffering, and choosing the outgoing address.
- NGINX admin guide, Content Caching: proxy_cache_path, what gets cached, cache keys, purging and limits.
- NGINX docs, ngx_http_proxy_module: the exact meaning and defaults of every directive used here, including buffering, proxy_cache_valid, proxy_cache_lock and proxy_cache_use_stale.
- NGINX docs, ngx_http_upstream_module: zone, keepalive, least_conn, and the $upstream_* timing variables.
- NGINX docs, ngx_stream_ssl_preread_module: reading SNI and ALPN from the ClientHello without terminating TLS.
- RFC 9111, HTTP Caching: the standard for shared caches, Cache-Control directives, freshness and Vary.
This article describes general patterns and our own small local simulation. It does not describe any company's private systems. The simulated numbers show the shape of the effect, not production measurements.
Frequently asked questions
What is the difference between a load balancer and a reverse proxy?
A reverse proxy is a server that sits in front of your servers, accepts the client's request and makes its own request to a server behind it. A load balancer is anything that decides which of several servers gets each request. An HTTP load balancer such as Nginx with an upstream block is a reverse proxy doing that job. A layer 4 load balancer that only forwards TCP packets is a load balancer but not an HTTP reverse proxy.
Is Nginx a load balancer or a reverse proxy?
Both. Nginx is a reverse proxy when you use proxy_pass, and it load balances when proxy_pass points at an upstream group with several servers. It can also cache responses (proxy_cache) and terminate TLS in the same server block.
Does a load balancer make each request faster?
No. In our simulation every request still needed 20 ms of work. Round robin over 3 servers cut the total from 10,000 ms to 3,340.4 ms and the median from 140 ms to 40.4 ms because each server had a shorter queue, not because the work got faster.
Why did the cached run still have a high p95?
Because 424 requests, 21.2% of the total, still missed the cache and queued at the one server, just as in the direct run. The p95 sits inside that slow group, so it was 158 ms against 160 ms direct. Caching helped the median (0.4 ms) far more than the tail.
What is a forward proxy?
A forward proxy acts for clients: a company or school network sends its users' requests through it, and websites see the proxy instead of the user. A reverse proxy acts for servers: clients think they are talking to the website, and the servers behind it stay hidden.
Were these numbers measured on real servers?
No. They come from a discrete event simulation on a virtual clock with a fixed seed (15), run on one machine with Node.js v22.13.1 on an Apple M2 Pro. There is no real network, TLS or CPU contention. It shows the shape of the effect, not production numbers.
Sources
- NGINX docs: Using nginx as HTTP load balancernginx.org
- NGINX admin guide: NGINX Reverse Proxydocs.nginx.com
- NGINX admin guide: NGINX Content Cachingdocs.nginx.com
- NGINX docs: Module ngx_http_proxy_modulenginx.org
- NGINX docs: Module ngx_http_upstream_modulenginx.org
- NGINX docs: Module ngx_stream_ssl_preread_modulenginx.org
- RFC 9111: HTTP Cachingrfc-editor.org

Written by a software engineer and system architect with 10+ years of building production web, payment, ticketing and accounting systems in Japan and Nepal. About us