Server failover: active-passive vs active-active
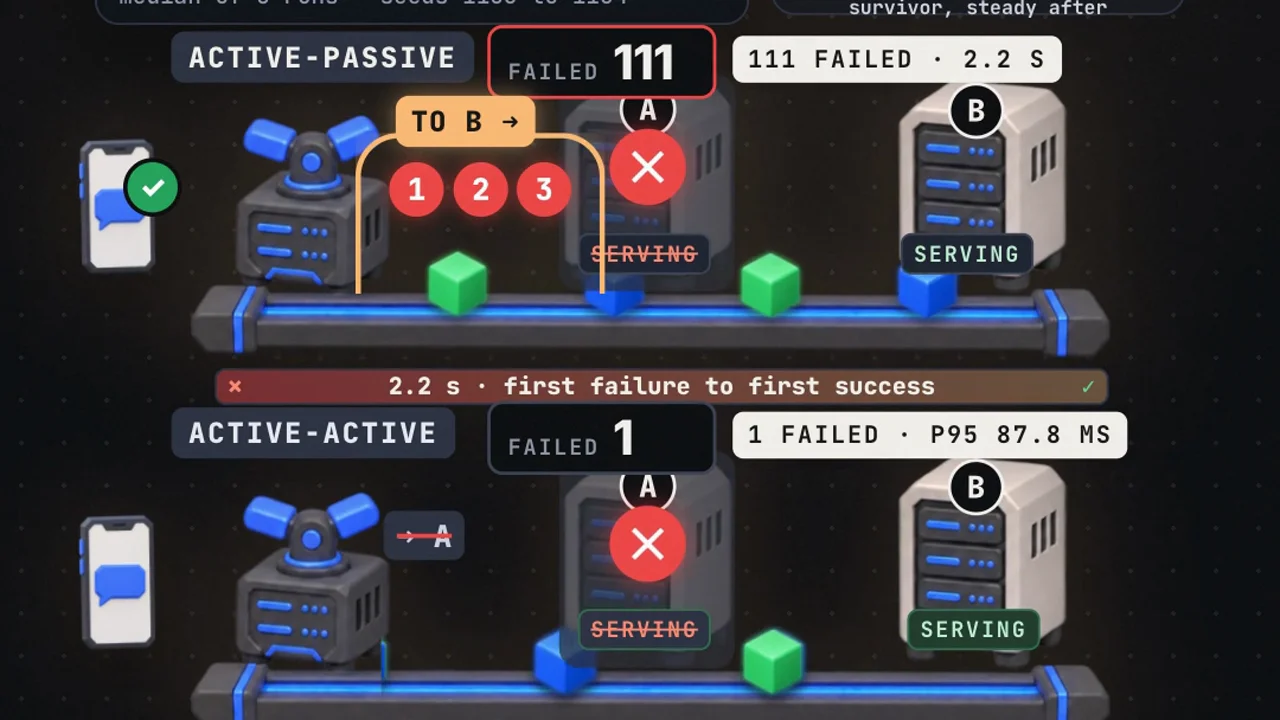
Active-passive vs active-active failover, measured: our simulation lost 111 requests waiting for three 1 s probes and 1 when the first error removed the server.
 Video · 60 secondsWatch the short versionSame diagrams and numbers. Tap to play.
In this lesson you will learn
- How probe interval, threshold, timeout and scheduling set the detection window
- Why detection policy sets the failed requests while topology sets who is ready to serve
- How Nginx shares failure state across workers, which errors count, and how to size N+1 headroom
Builds on Lesson 10: Availability in sequence vs parallel 5 min read + 60 s video Next: Replication: primary and read replicas
Drafted with AI assistance, then checked and edited by a human engineer · How we write
Short answer
Server failover is detection plus spare capacity. In our one-machine simulation at 50 req/s, the active-passive setup (probes every 1 s, switch after 3 misses) lost a median 111 requests over a 2.2 s gap; the active-active setup, which dropped a server on its first failed request, lost 1, and the survivor's p95 rose from 79.1 to 87.8 ms.
| Active-passive in our simulation | Median 111 failed requests (range 102 to 148) and a 2,217.2 ms gap from first failure to first success (range 2,101.1 to 2,994.8), with checks every 1,000 ms and a switch after 3 misses |
|---|---|
| Active-active in our simulation | 1 failed request in every run; gap median 35.9 ms; a newly sent request succeeded a median 53.3 ms after the first failure |
| Failed requests ≈ arrivals routed to the dead server | 50 req/s × 2.2172 s ≈ 110.9, matching the measured median of 111 |
| Detection time with active checks | With probes started on a fixed schedule and a server that refuses at once: (threshold minus 1) × interval to threshold × interval, 2 to 3 s for 1 s × 3; a hung server adds the probe timeout |
| The survivor pays | Active-active p95 for successful requests: 79.1 ms on both servers before the kill, 87.8 ms on the survivor after; per-server utilisation went from 0.375 to 0.75 |
| Cold standby | The idle spare's p95 in its first second was 259.2 ms (assumed warm-up: +30 ms fading over 50 requests), against 90.3 ms once steady |
| Setup | Our simulation, labs/sd-11: in-process, virtual clock, 50 req/s for 30 s, kill at 10 s, 2 servers × 2 workers, seeds 1100 to 1104, Node v22.13.1, Apple M2 Pro. Not a benchmark |
In active-passive vs active-active failover, every request routed to a dead server fails until the load balancer stops routing there, so the loss depends on how fast it notices and on who is ready to take over. In our simulation at 50 requests per second, an active-passive setup that waited for three 1 s probes lost a median 111 requests, and an active-active setup that dropped a server on its first failed request lost 1.
What our lab measured
Copies side by side only help if the switch is quick, and every second of the gap comes out of the downtime budget. labs/sd-11/run.mjs measures that gap in a discrete-event simulation: one Node.js process (v22.13.1, Apple M2 Pro), a virtual clock, nothing on a real port. It shows the shape of the effect and is not a benchmark. The code and every run's output are on GitHub, so you can run it yourself: failover-lab.
load        50 req/s for 30 s; primary killed at 10 s
servers     2, each with 2 workers and a queue; service 8 ms + exp(mean 22 ms); 1 ms per hop
failure     requests in flight fail as "reset"; later ones are "refused" at once (closed port)
A-P         all traffic to the primary; probe every 1,000 ms; switch after 3 misses;
            cold standby (assumed +30 ms on its first request, fading over 50)
A-A         round robin over two warm servers; drop a server on its first failed request; no retries
runs 5 per mode, seeds 1100 to 1104; median (min to max)| Measure | Active-passive | Active-active |
|---|---|---|
| Failed requests | 111 (102 to 148) | 1 in every run |
| First failure to first success | 2,217.2 ms (2,101.1 to 2,994.8) | 35.9 ms (0.9 to 80.3) |
| p95 before the kill | 92.2 ms | 79.1 ms |
| p95 in the first second after | 259.2 ms (cold standby) | 78.3 ms |
| p95 steady after | 90.3 ms | 87.8 ms (survivor) |
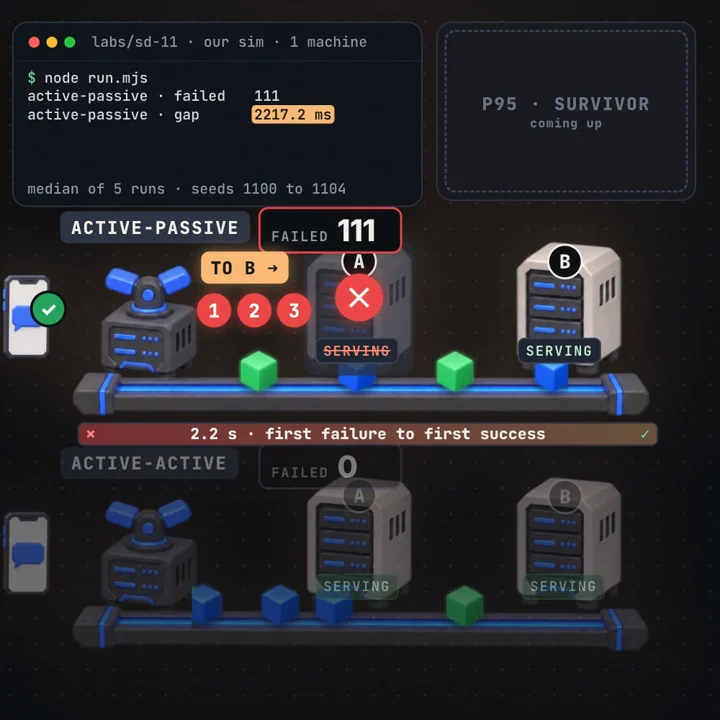
The configurations used different detection policies, so 111 versus 1 measures detection as much as topology. Detection policy sets how long traffic keeps going to the dead server, and topology sets which servers are already serving, how warm they are and how much headroom they have.
How long does active-passive detection take?
Assume probes start on a fixed schedule every I seconds, the probe timeout T is shorter than I, the crash lands at a uniformly random moment, and the dead server refuses connections at once. With a threshold of k misses, the first failing probe starts somewhere in the next I seconds and the k-th starts (k minus 1) × I after it:
best      (k - 1) × I      first probe fires right after the crash
worst     k × I            first probe fires just before the crash
expected  (k - 0.5) × I

lab, I = 1 s, k = 3:   2 s to 3 s, expected 2.5 s
failed ≈ rate × time:  50 × 2 = 100  to  50 × 3 = 150
median run:            50 × 2.2172 s ≈ 110.9    measured 111
All five gaps fell inside that window, plus a few milliseconds for the standby's first response. Almost every failure was "refused" during detection; only 0 to 4 per run were in flight at the crash.
A hung server adds the probe timeout T: one T on a fixed schedule, and k × T if each probe starts I after the previous one ends. With I = 1 s, k = 3 and T = 0.5 s, that is 2.5 to 3.5 s against 3.5 to 4.5 s.
Defaults are slower. HAProxy's inter 2 s and fall 3 give 4 to 6 s. A Kubernetes readiness probe at its defaults (10 s, threshold 3) needs 20 to 30 s before the endpoint update even starts spreading to nodes.
A probe that only proves the process is up misses real failures, and one that queries the database fails on every server at once when the database does. Compare probe results with request failures. When every server fails at once, check shared dependencies first, then decide whether removing every backend improves service.
The cold standby added its own cost: with the assumed +30 ms, two workers could serve about 33 req/s while 50 arrived, so a queue built and the first-second p95 reached 259.2 ms.
Why did active-active lose only one request?
Round robin gave each server one request about every 40 ms. The first request to the dead primary was refused, the error came back after two 1 ms hops, and the load balancer (how it picks a backend) removed the server well before its next turn. That is a passive health check with a threshold of one: real traffic acted as the probe, and the refusal made the failure obvious at once.
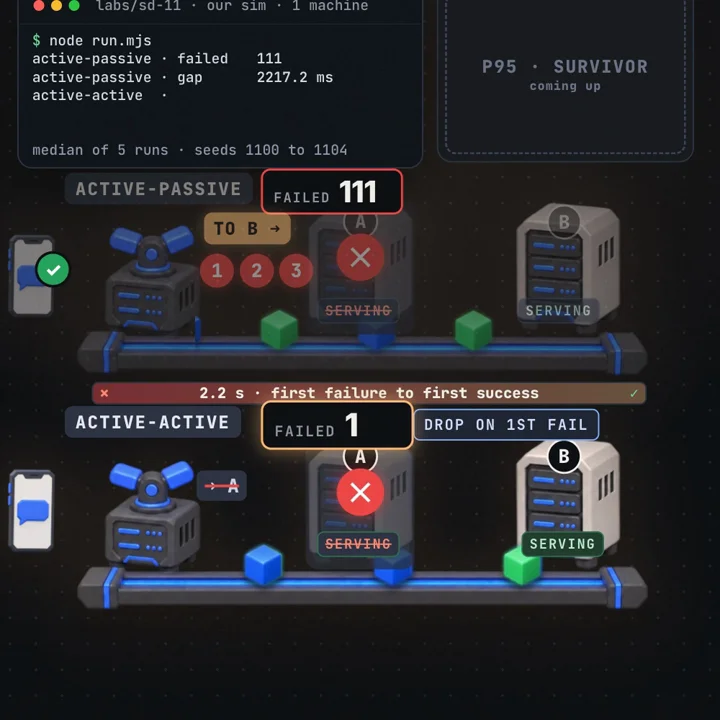
By the formula, active-active with three 1 s probes would lose about 50 to 75 (half the traffic for 2 to 3 s), and active-passive with the first-error rule would lose about one; we did not run either. A retry through Nginx's proxy_next_upstream could hide that last failure. A refused connection sent nothing, so even a POST can move on; once a POST was sent, Nginx does not resend it by default.
Why does the survivor slow down?
In our active-active runs the survivor took double load, and its steady p95 went up. Utilisation U is arrival rate × mean service time ÷ workers:
S = 30 ms mean, c = 2 workers
before: 25 req/s each    U = 25 × 0.030 ÷ 2 = 0.375    p95 79.1 ms
after:  50 req/s on one  U = 50 × 0.030 ÷ 2 = 0.75     p95 87.8 ms

N servers at u each, one lost: survivors run at u × N ÷ (N - 1)
to keep survivors at or below 0.75:  N = 2: 0.375   N = 3: 0.50   N = 4: 0.5625
The lab's arrivals are evenly spaced, so the rise was only 8.7 ms. With random arrivals the M/M/2 model's mean wait goes from 4.9 ms at U = 0.375 to 38.6 ms at U = 0.75 (why waiting grows near full load). Without headroom, survivors fail their own checks and are removed in turn, as the SRE book on cascading failures describes.
Inside Nginx: shared failure state, retries and logs
Our active-active lane resembles an open source Nginx upstream with max_fails=1 and no retries, with two differences. The simulation removed the dead server for good, while Nginx makes the peer eligible again after fail_timeout; a continuing failure can therefore cause further failed attempts. And without a zone directive, each worker process keeps its own failure counters and "unavailable until" marks, so each worker receiving traffic may independently discover the failure. zone app 64k; moves that state into shared memory. Requests already assigned to the dead server still fail, because Nginx records the failure only when it releases the failed peer (ngx_http_upstream_free_round_robin_peer).
Connection errors, timeouts and invalid headers always count toward max_fails; a 500, 502, 503 or 504, or 429, counts only if its http_* value is listed in proxy_next_upstream. A server that answers 500 to everything stays in rotation by default.
# nginx.conf (http context): active-active, passive checks, bounded retry
upstream app {
    zone app 64k;   # share failure counters and down marks across workers
    server 10.0.0.1:8080 max_fails=1 fail_timeout=10s;
    server 10.0.0.2:8080 max_fails=1 fail_timeout=10s;
}
log_format upstream '$remote_addr "$request" status=$status rt=$request_time '
                    'ua="$upstream_addr" us="$upstream_status" '
                    'uct="$upstream_connect_time" urt="$upstream_response_time"';
server {
    listen 80;
    access_log /var/log/nginx/upstream.log upstream;
    location / {
        proxy_pass http://app;
        proxy_next_upstream error timeout;   # which failures are retried
        proxy_next_upstream_tries 2;         # at most 2 attempts (default 0 = no limit)
        proxy_next_upstream_timeout 3s;      # no new attempt after 3 s
        proxy_connect_timeout 1s;
        proxy_send_timeout 5s;               # inactivity between writes (default 60 s)
        proxy_read_timeout 5s;               # inactivity between reads (default 60 s)
    }
}
The send and read timeouts measure inactivity between two successive operations, so a response can continue indefinitely while it keeps making progress. If the first connection times out after 1 s and the second backend sends no response bytes, the read timeout adds about 5 s. These settings impose no overall response deadline (proxy_read_timeout); enforce one in the client or a layer in front.
When a request is retried, each $upstream_* variable holds one comma-separated entry per server tried. Illustrative lines, not captured from our lab:
refused, retried:    status=200 ua="10.0.0.1:8080, 10.0.0.2:8080" us="502, 200" urt="0.000, 0.031"
connect timeout:     status=200 ua="10.0.0.1:8080, 10.0.0.2:8080" us="504, 200" urt="1.001, 0.029"
no response bytes:   status=504 ua="10.0.0.1:8080" us="504" urt="5.002"   (POST, not retried)
all marked down:     status=502 ua="app" us="502"   error log: no live upstreams
A refused connection is an explicit rejection, often because no process is listening. A connect timeout means the connection did not complete before its deadline; investigate the backend and network. A comma in ua shows multiple upstream attempts. Check the final client status to see whether the retry succeeded (upstream variables).
Databases, virtual IPs and DNS
Our lab stores no data and moves no address. A database standby fed by asynchronous replication can miss writes acknowledged just before the crash (replication lag), and a node paused past its lease can still finish a write, so the storage must reject older fencing tokens or the old primary must be isolated before promotion (Kleppmann). A VRRP virtual IP adds its own timer, 3.609375 s at priority 100 and a 1 s interval (RFC 9568, section 6.1). DNS failover also depends on detection, record updates, remaining cache lifetimes and when clients reconnect.
Active-passive vs active-active: which to use
| Option | Good for | Costs you |
|---|---|---|
| Active-passive, active checks | a single writer such as a database primary | seconds of errors (111 in our simulation), idle hardware, cold start |
| Active-active, passive checks | stateless app servers (1 failed in our simulation) | N+1 headroom on every server; survivor latency rises |
| Either, plus retries | hiding the last failed request | duplicate side effects without idempotency keys; retry storms |
Our take
For stateless app servers we would run active-active, remove a backend on real request errors, add zone in Nginx, and keep each of two servers at or below 37.5% utilisation if the survivor must stay at or below 75%. Keep active-passive where only one node may write, with fencing. Either way, compute your detection window from the real interval, threshold and timeout, and fail over on purpose now and then, because a spare that has never served can hide a cold start or a stale config.
This article describes general patterns and our own small simulation. It does not describe any company's private systems. The simulated numbers show the shape of the trade-off, not production measurements.
Frequently asked questions
What is the difference between active-passive and active-active?
In active-passive, one server takes all traffic while a standby waits and is switched in after the primary fails. In active-active, every server takes a share all the time, so a failure only removes one server from the rotation.
Why did active-passive lose 111 requests and active-active only 1?
Mostly detection policy. The active-passive setup kept routing to the dead primary until three 1 s probes failed, about 2.2 s at 50 req/s. The active-active setup removed the server after the first real request failed.
How much spare capacity does active-active need?
Enough for the survivors to carry the lost server's share. With N servers at utilisation u, survivors run at u × N ÷ (N minus 1), so two servers that must stay under 75% after a loss should each run at or below 37.5%.
Sources
- Nginx documentation: ngx_http_upstream_module (zone, max_fails, fail_timeout, backup)nginx.org
- Nginx documentation: ngx_http_proxy_module (proxy_next_upstream and retry limits)nginx.org
- HAProxy 3.2 configuration manual (inter, fastinter, fall, rise, observe)docs.haproxy.org
- Kubernetes documentation: Configure Liveness, Readiness and Startup Probeskubernetes.io
- RFC 9568: Virtual Router Redundancy Protocol (VRRP) Version 3rfc-editor.org
- Martin Kleppmann: How to do distributed locking (fencing tokens)martin.kleppmann.com
- Google SRE book: Addressing Cascading Failuressre.google

Written by a software engineer and system architect with 10+ years of building production web, payment, ticketing and accounting systems in Japan and Nepal. About us