Monolith vs microservices: fault isolation and its cost
Monolith vs microservices: worker pools, crash isolation, deployment risks, and the latency and data-consistency costs of splitting services.
In this lesson you will learn
- Why one slow feature can starve every other feature of a shared worker pool, worked out with Little's law
- Why per-feature pools (bulkheads) contain slow calls but only separate processes contain crashes
- What splitting costs: a network hop on every call, more deploys and dashboards, harder debugging and data spread across services
Builds on Lesson 18: Horizontal vs vertical scaling 30 min read Next: SQL vs NoSQL
Drafted with AI assistance, then checked and edited by a human engineer · How we write
Short answer
Separate services can contain process-fatal faults; bulkheads contain resource exhaustion. Shared dependencies and synchronous calls can still propagate failures. In our simulation (assumed timings), slow recommendations failed 97.5% of checkouts in one shared app and 0.0% split; a crash loop, 98.7% vs 0.0%. The price: about 2.6 ms more checkout latency, plus more to deploy and debug.
| Slow feature, one app | With recommendations taking 2 s per call, 97.5% of checkouts failed in the shared 16-worker app and orders fell from 39.7 to 1.0 per second |
|---|---|
| Slow feature, split | With the same slow recommendations, checkout errors were 0.0% in the split version, 39.7 orders per second, checkout p95 32.42 ms; recommendations itself still failed 100% |
| Crash loop | Every recommendations call crashing its process after 50 ms (2 s assumed restart): checkout errors 98.7% and 0.5 orders/s in one app, 0.0% and 39.7 orders/s split |
| Redeploy | Shipping one feature at 8 s with an assumed 4 s whole-app restart failed 157 checkouts (22.0%); an assumed 1.5 s restart of one service failed none |
| Normal day cost | Checkout p50 20.14 ms in one app vs 22.72 ms split (+2.58 ms), p95 29.75 vs 32.34 ms, about the size of the assumed hop |
| Amazon, public record | In a 2006 ACM Queue interview Amazon's CTO said Amazon.com started as a monolithic application and that its gateway page calls more than 100 services |
| Setup | Our virtual-clock simulation (labs/sd-19), seed 19, 200 req/s, 16 workers in both designs; hop, gateway and restart durations are assumed inputs. Not a benchmark and not Amazon's numbers |
Monolith vs microservices is a choice about deployment, resource sharing and failure boundaries. When every feature of an app shares one process and one pool of workers, one bad feature can take all the others down with it: a slow dependency holds the workers, a crash kills the process, a deploy restarts everything. Splitting the app into separately run services contains that damage, and charges a network hop, more moving parts and harder debugging for it. The question for this part: what exactly does a split isolate, what can a monolith isolate on its own, and what does it cost on a normal day?
Prerequisites
Queues and Little's law. A server with a fixed number of workers is a queue. Little's law says the number of requests in the system L equals the arrival rate λ times the time each one spends there W. Turned around, it tells you how many workers a stream of requests keeps busy: arrivals per second times seconds per request. When that number exceeds the workers you have, arrivals outpace completions and a backlog builds; it grows until something removes work, such as clients giving up or the server shedding load. That is the effect behind a fast server being slow for a million users.
Availability in series. If a request needs two components to both work and their failures are independent, their availabilities multiply, so the chain is weaker than either part. Correlated failures (a shared database, network or deploy) need the joint probability instead. Two servers in a row fail more often than one. Splitting an app turns function calls into network calls, and every synchronous call adds a link to that chain.
Scaling out is not splitting. Part 18, one big server or 8 small ones, made identical copies of one app. Copies survive a machine dying, not a bug in one feature, because every copy runs the same code. This part splits by feature, a different move.
Definitions
Monolith: an application whose features are built and deployed as one unit, usually running as one kind of process that shares its workers, memory and database connections across all features.
Microservices: an architecture in which features run as separately deployed services that communicate over the network through defined interfaces, each with its own resources and usually its own data.
Fault isolation: the property that a failure in one component affects only that component's work. The area a failure can reach is its blast radius.
Bulkhead: a fixed share of a resource (threads, connections, processes) reserved for one feature or caller, so that exhausting it cannot exhaust the others. The name comes from the walls that divide a ship's hull into compartments.
Timeout: the longest a caller waits for a response before giving up. Giving up does not by itself stop the work or free what the work holds: stopping needs cancellation that the work honours, and a slot or connection should be released only once the work has actually stopped.
Circuit breaker: a wrapper around calls to a dependency that, after enough failures, stops calling it for a while and fails fast instead, then lets a few trial calls through to check whether it has recovered.
Service boundary: the line between what one service owns (its code, its data, its deploys) and what it can reach only through another service's interface.
Monolith vs microservices: how resource isolation works
In a 2006 ACM Queue interview, Amazon's CTO said Amazon.com started as a monolithic application, and that by then a single request for the Amazon.com gateway page called more than 100 services to assemble the page. He described services that each own their data, reachable only through the service's interface, built and run by the team that wrote them ("you build it, you run it"). That is the public record, and it is all this article says about Amazon. The rest is mechanism you can reproduce.
Our lab (labs/sd-19, Code) models a toy shop with three features: checkout, search and recommendations (recs). It runs both designs on a virtual clock, with exactly the same traffic stream for each:
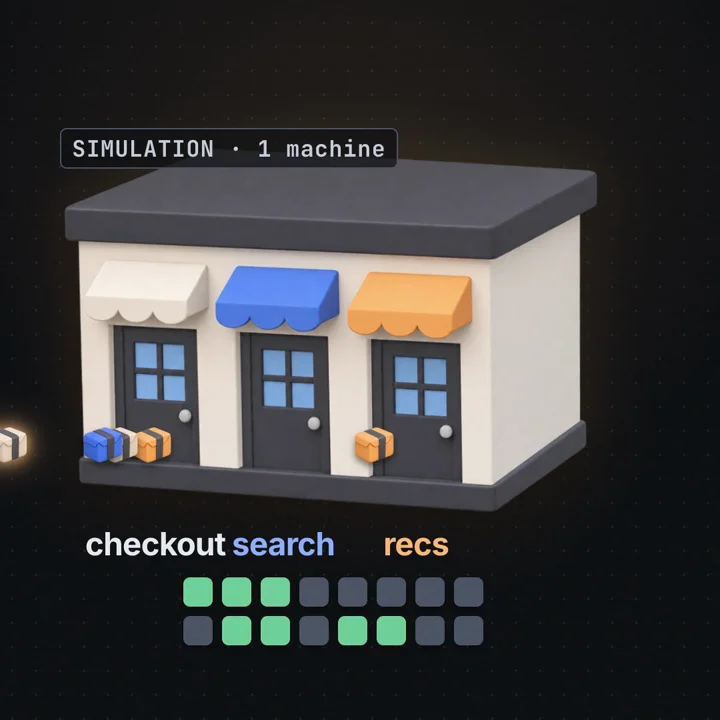
traffic     200 req/s, Poisson arrivals, same random stream for both designs
mix         checkout 20% (40/s), search 40% (80/s), recs 40% (80/s)
service     base 20 / 10 / 15 ms, drawn uniform 0.5x to 1.5x,
            3% of calls take 3x, so mean 21.2 / 10.6 / 15.9 ms
monolith    one process, one pool of 16 workers, one FIFO queue
split       three services: checkout 4 workers, search 6, recs 6 (same 16)
            gateway 0.2 ms + assumed hop 0.8 to 1.6 ms each way
clients     give up after 1 s; a request that waited longer is an error
run         20 s per scenario, first 2 s not counted, seed 19
Both designs get the same 16 workers, so neither wins by having more capacity. On a normal day the load is light. By Little's law the busy workers are:
monolith   40/s x 21.2 ms + 80/s x 10.6 ms + 80/s x 15.9 ms
         = 0.85 + 0.85 + 1.27 = 2.97 workers of 16       (about 19% busy)
split      checkout 0.85 of 4 (21%)   search 0.85 of 6 (14%)   recs 1.27 of 6 (21%)
At under a quarter busy, almost nothing waits in either design. The lab then breaks recs in three ways (slow, crash loop, redeploy) and watches checkout, the feature a team would protect first.
A worker here is anything a request holds while it runs and that exists in limited number. In a Java server it is a pooled thread. In Node.js or Go, where waiting is cheap, it is usually a database connection pool, an HTTP client's socket limit or memory. The arithmetic is the same.
Why does one slow feature stop checkout?
In the slow scenario, from t = 2 s every recs call takes 2 s, the way a call to a struggling dependency might. Nothing crashes. Every recs call still holds a worker for its whole duration.
Little's law says how many workers recs now needs:
recs busy workers  = 80 req/s x 2 s = 160 workers
available          = 16 (monolith, shared)   6 (split, recs only)
time to fill 16    ≈ 16 / 80 per s = 0.2 s after the slowdown starts (rough)
The 0.2 s is a rough filling estimate, not a deterministic result: arrivals are Poisson, so recs calls come in bursts and gaps, and at t = 2 s about 3 workers are already busy with normal work, which shortens it. Once every worker holds a recs call, the pool completes at most about 16 / 2 s = 8 recs calls per second. It helps to keep four rates apart:
offered     200 req/s arrive at the shared queue
admitted    whatever a free worker picks up; a 2 s recs call pins that worker
completed   about 8 recs/s when the pool is full of recs, plus the few others that slip through
expired     entries older than the 1 s client timeout, failed and discarded when a free worker finds them at the front
The backlog grows quickly while offered work far exceeds completions. The lab expires entries lazily: only when a worker frees does it discard the head entries that waited more than 1 s (at no worker cost). Lazy expiry prevents indefinite accumulation under these finite service times, but expired entries remain until a worker checks the queue; queue size can exceed 200. With every worker pinned by a 2 s recs call, the gaps between checks can be long, and arrivals keep piling up behind the stale head in the meantime. The lab does not instrument queue length, so we quote no numerical bound. A checkout arriving now waits behind that backlog and usually expires before it reaches a worker. The few that completed had spent most of their second in line. A real server only gets that cheap expiry if it checks each request's deadline before starting it; otherwise it spends its scarce workers on requests whose clients already left. The result over the 18 counted seconds:
                      checkout errors   orders/s   recs errors
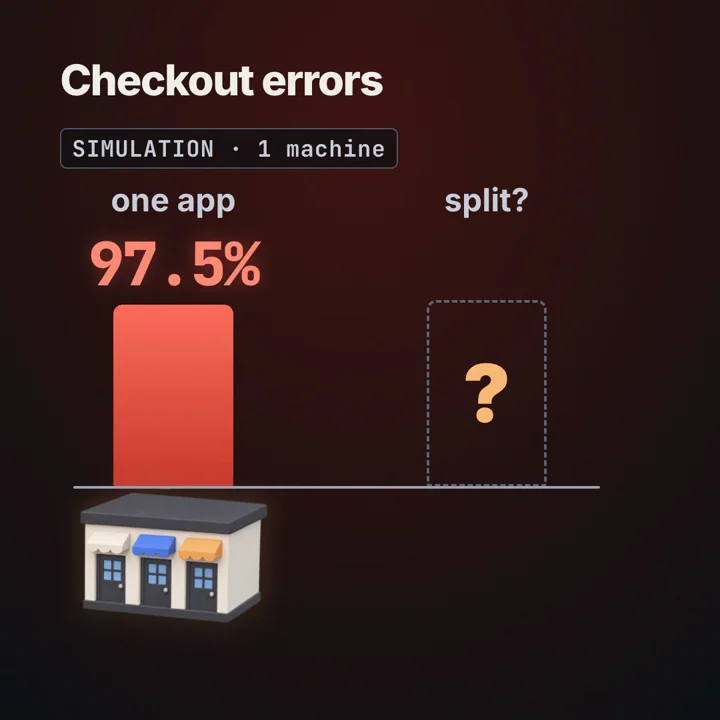
monolith (shared 16)  97.5%             1.0        100%
split (4 / 6 / 6)     0.0%              39.7       100%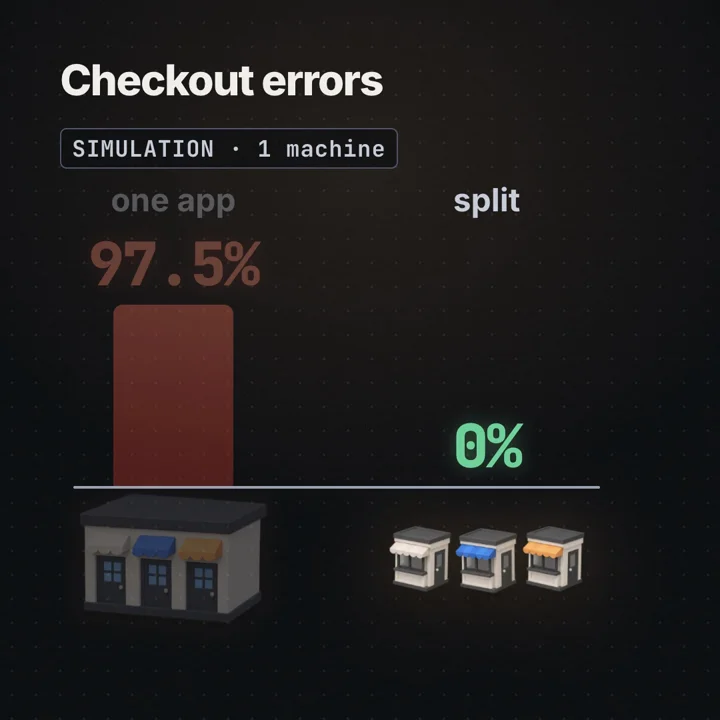
In the split version recs is exactly as broken: it needs 160 workers and has 6, so it fails 100%. The split did not fix recs. It moved the damage from "everything" to "recs". Checkout still needs only 40/s × 21.2 ms ≈ 0.85 of its 4 workers, so it ran at 39.7 orders per second, the same as a normal day, with a p95 of 32.42 ms against 32.34 ms on a normal day.
What did the isolating was not the network. It was that recs could hold at most 6 workers and never checkout's 4. That is a bulkhead, and a monolith can have one too. The Azure Architecture Center's bulkhead pattern describes it: partition resources per consumer or dependency so one cannot exhaust the rest. In one process each feature gets its own thread pool or semaphore, and recs calls that find theirs full are rejected at once instead of queuing in front of checkout.
A timeout helps too, but only when it is short enough, and Little's law gives a bound. A timeout caps W for recs, provided cancellation really releases the worker when it fires. The other features keep their normal load; recs' normal 1.27 workers are not subtracted, because its slow calls replace them:
other load        = 40 x 0.0212 + 80 x 0.0106 = 0.848 + 0.848 = 1.696 workers
recs boundary     = (16 - 1.696) / 80 req/s = 0.1788 s ≈ 178.8 ms
with 300 ms       = 80 x 0.3 = 24 recs workers + 1.7   > 16, saturates
with the 1 s client timeout = 80 x 1.0 = 80 workers    > 16
178.8 ms is a mean-load stability boundary, not a safe value and not a latency guarantee. Little's law is about averages: at that timeout the pool is about 100% busy on average, so any Poisson burst builds a queue and queue wait goes up without bound as utilisation nears 1. A recs traffic spike lowers the boundary in proportion. In production pick a timeout well under the boundary (aim for a peak utilisation around 70 to 80%), bound admission with a bulkhead or a short queue, and measure queue wait directly (time from enqueue to start), not only service time. A bulkhead gives a fixed partition: checkout keeps its share whatever recs does. Use both: the bulkhead limits how many workers recs takes, the timeout how long it holds each.
Why can't a worker pool stop a crash?
In the crash scenario, from t = 2 s every recs call hits an unhandled, process-fatal fault 50 ms in: in this lab the fault always ends the process. In real runtimes that depends on the fault. A segfault in native code, an uncaught exception in Node.js (which exits by default) or an OOM kill ends the process; a Java NullPointerException usually fails only the request unless nothing catches it. A crashed process takes an assumed 2 s to restart, and then the next recs call kills it again: a crash loop.
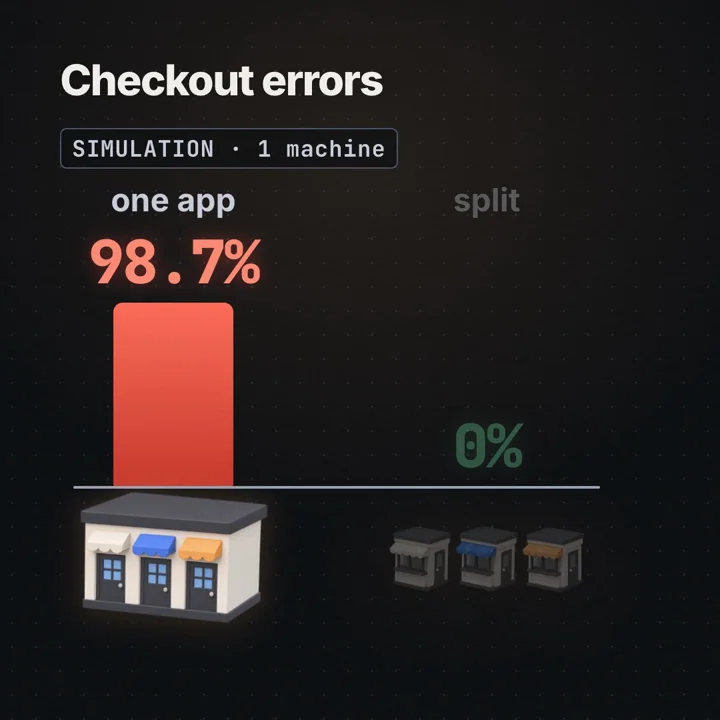
A per-feature pool does nothing here. Pools divide workers inside one process; a crash ends the process, and with it every worker, every in-flight request and every queued request, whatever pool they were in. The monolith's cycle looks like this:
restart finishes
  first recs arrives after about 1 / 80 s = 12.5 ms on average
  it crashes the process 50 ms later
up for about 62.5 ms, then down 2,000 ms
up fraction ≈ 62.5 / 2,062.5 ≈ 3%
During that short window a checkout must arrive and also finish its roughly 20 ms of work before the crash, or it dies in flight. So well under 3% can succeed. The lab measured 98.7% checkout errors, 0.5 orders per second, which is 0.5 / 40 ≈ 1.3% success. In the split version only the recs service loops; checkout's process never runs recs code, so checkout was at 0.0% errors and 39.7 orders per second. Recs again failed 100% in both designs.
This is the line between the two tools, and it is the main lesson of the lab:
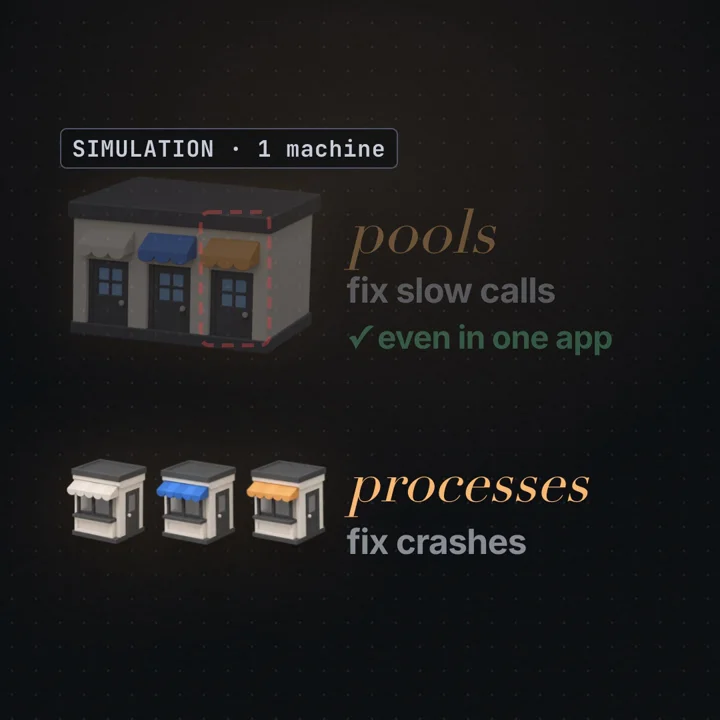
- Separate pools (bulkheads) contain slow calls. The bad feature can only use up its own share.
- Separate processes contain process-fatal faults. The kernel gives each process its own address space, so a wild pointer or an unhandled fault in one does not corrupt or end another.
That containment stops at the resources and dependencies the processes still share:
- Host memory. With cgroup v2, a container that exceeds its own
memory.maxgets an OOM kill inside its cgroup, and the others survive. If the host itself runs out (limits overcommitted, or none set), the kernel's global OOM killer picks a victim by its own scoring, which can be checkout. Detect which one you hit from the cgroup'smemory.eventsandmemory.events.localfiles:oom_killcounts kills, and.localcounts only those in this cgroup rather than its descendants (Linux cgroup v2 documentation). Kills on the node with no cgroup limit reached, visible indmesg, point at host-level pressure. - CPU, disk and network on a shared node: a recs CPU spike without limits slows checkout's latency, without any crash.
- Shared databases and caches. A recs query that holds locks or exhausts connections slows checkout whatever processes they run in.
- Data changes. A recs release that rewrites a shared table or an event format can break checkout without recs ever crashing.
Two more details matter. First, replicas do not help with a crash a request triggers: every copy of the monolith runs recs code, and the load balancer spreads the poison request to all of them. Replicas protect against a machine failing; separate processes per feature protect against a code path failing. Second, process isolation does not need separate codebases. You can deploy one build several times with different roles, one serving only checkout and another only recs, a common first step before a real split.
What does shipping one feature cost?
The third scenario is not a failure at all: at t = 8 s the team ships a change to recs. In the monolith that means restarting the whole app, assumed to take 4 s to stop, boot and warm up. In the split version only the recs service restarts, assumed 1.5 s. Both times are inputs we chose, not measurements.
monolith   restart 4 s   expected lost checkouts ≈ 40/s x 4 s = 160
                         lab: 157 failed checkouts, 22.0% of all counted checkouts
                         (about 40/s x 18 s = 720 expected)
split      recs restarts 1.5 s, checkout never stops
                         lab: 0 failed checkouts, 0.0%
This is the number the video did not have room for: one redeploy of one feature dropped 157 checkouts in the one app, and none in the split version. Real deploys avoid most of this with rolling updates (start new copies, wait until they report ready, then stop old ones), and a monolith can do that too. What it cannot avoid is that every deploy of any feature replaces the process running all of them, so every release carries the risk of every feature. With separate services a bad recs release that crashes or slows recs stays inside recs, as long as the two share no database, host resources without limits, or data formats the release changes; within those limits its team ships without coordinating with checkout's. The interview describes that independence, small teams owning and running their services, as a main reason for the move.
What does the split cost on a normal day?
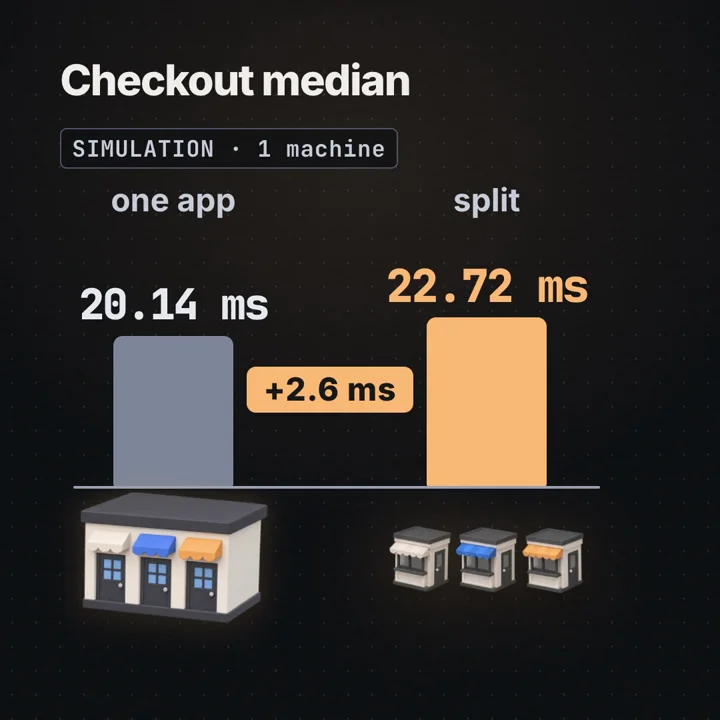
Every request in the split version crosses the gateway and two hops. The expected extra time follows from the assumed inputs:
gateway 0.2 ms + hop there (mean of 0.8 to 1.6) 1.2 ms + hop back 1.2 ms = 2.6 ms
lab, checkout p50:  20.14 ms monolith vs 22.72 ms split   (+2.58 ms)
lab, checkout p95:  29.75 ms monolith vs 32.34 ms split   (+2.59 ms)
The measured gap is the assumed hop, which only says the simulation does what it was told. Real hops include serialisation, TLS, connection setup and perhaps a cross-zone link, and they stack: calls in sequence pay the hop each time, calls in parallel pay the slowest of many. The lab's checkout makes no further calls, so it pays once.
The latency is the cheap part. The costs that decide whether a split is worth it are mostly outside the request path:
- Deploys. Three pipelines, three sets of versions, and contracts between them that must stay compatible while old and new versions run side by side.
- Monitoring. Each service needs its own health checks, dashboards, alerts and on-call owner. Detection settings like those in what happens when the main server dies at 3 a.m. now exist per service.
- Debugging. A slow page is now a chain of calls across processes. Without distributed tracing (a trace ID passed along every call), finding which hop was slow means reading several logs by hand.
- Distributed data. If each service owns its data, a transaction that used to be one database commit spans services, and you lose cross-feature joins. The next section works through what replaces the commit. Reads may come from replicas or copies, as in one database writes, ten read, with the same staleness questions.
- Availability arithmetic. Each synchronous call between services adds a component in series. Assuming independent availability events, a request that needs five services at 99.9% each is 0.9995 = 0.99500999, approximately 99.501% available. Correlated failures require the joint probability: five services that always fail together (one shared database, one bad deploy) can jointly reach 99.9%, while failures that cluster on the busiest hour can make it worse than the product suggests.
What replaces the checkout transaction: outbox and saga
In the monolith, placing an order and reserving stock is one commit. Split into an orders service and an inventory service with their own databases, there is no commit spanning both, and "write the order, then publish an event" has a gap: crash between the two and the order exists with no event, or the event goes out for an order that rolled back. The transactional outbox closes it by writing the event into the same database, in the same transaction, as the order:
-- orders service, PostgreSQL: the order and its event commit together or not at all
BEGIN;
INSERT INTO orders (id, customer_id, total_cents, status)
VALUES ('7f3c...', 42, 4999, 'pending');
INSERT INTO outbox (event_id, aggregate_id, type, payload, created_at)
VALUES (gen_random_uuid(), '7f3c...', 'OrderPlaced', '{"sku":"A1","qty":1}', now());
COMMIT;

-- relay: claim, publish and mark in ONE transaction on ONE connection
BEGIN;
SELECT event_id, type, payload FROM outbox
WHERE published_at IS NULL ORDER BY created_at
LIMIT 100 FOR UPDATE SKIP LOCKED;         -- row locks last until COMMIT or ROLLBACK
-- ...publish each to the broker; wait for acks, but never longer than a fixed bound (say 5 s)...
UPDATE outbox SET published_at = now() WHERE event_id = ANY($1);   -- $1 = only the acked ids
COMMIT;                                   -- broker error or bound exceeded: ROLLBACK, rows unlock
PostgreSQL gives the atomicity: both inserts are in one transaction, and FOR UPDATE SKIP LOCKED lets several relay processes take disjoint batches. The BEGIN before the relay's SELECT is what makes that work. Row locks taken by FOR UPDATE are held until the transaction ends (PostgreSQL explicit locking, row-level locks); in autocommit mode the SELECT is its own transaction, its locks vanish the moment it returns, and a second relay can claim the same batch. So the claim, the publish and the mark must run on the same connection inside one transaction, and any failure (broker error, ack wait past its bound, relay exception) must ROLLBACK so the rows unlock for the next relay.
Holding a transaction open across network I/O is a deliberate cost. For the length of the publish the relay pins a database connection, holds row locks, and holds back the database's removal horizon, so VACUUM cannot clean up rows that died after the transaction began until it ends. Keep batches small, bound every broker wait, and set idle_in_transaction_session_timeout on the relay's role a little above that bound as a backstop. The alternative is a lease: claim rows in a short transaction that only stamps them (UPDATE outbox SET claimed_by = $me, claimed_until = now() + interval '30 seconds' WHERE event_id IN (SELECT event_id FROM outbox WHERE published_at IS NULL AND (claimed_until IS NULL OR claimed_until < now()) ORDER BY created_at LIMIT 100 FOR UPDATE SKIP LOCKED) RETURNING ...), commit, publish with no transaction open, then mark. A relay that dies or stalls past its lease lets another relay take the rows over, which is again a duplicate send.
gen_random_uuid() is built in since PostgreSQL 13. What the outbox does not give is exactly-once delivery. The relay publishes and then marks; if it crashes after the broker acks and before the COMMIT, the next relay publishes the same rows again. The guarantee is at-least-once, so every consumer must deduplicate by the event ID, in the same transaction as its own effect. That transaction must also record the outcome, whichever it is:
-- inventory service: dedup, decide, and record the outcome in one transaction
BEGIN;
INSERT INTO processed_events (event_id) VALUES ($1)
ON CONFLICT (event_id) DO NOTHING;        -- 0 rows: duplicate, so ROLLBACK and ack the message

UPDATE stock SET reserved = reserved + $3
WHERE sku = $2 AND available - reserved >= $3
RETURNING sku, available - reserved AS left_after;   -- 1 row: reserved; 0 rows: not enough stock

-- the app picks the event type from the UPDATE's result, then writes it to inventory's own outbox
INSERT INTO inventory_outbox (event_id, aggregate_id, type, payload, created_at)
VALUES (gen_random_uuid(), $4, 'StockReserved', '{"sku":"A1","qty":1}', now());  -- or 'StockRejected'
COMMIT;
The dedup row, the stock change (or the decision not to make one) and the outcome event commit together. A redelivered OrderPlaced hits the dedup key and is skipped, but its outcome already sits in inventory_outbox, and inventory's relay publishes it exactly as the orders relay does. Without the outcome event, an out-of-stock order would be committed as "processed" with nothing said, and the order would stay pending forever.
The orders service consumes those outcomes the same way: dedup by event ID, then a conditional update. StockReserved moves the order to the payment step (UPDATE orders SET status = 'awaiting_payment' WHERE id = $1 AND status = 'pending'); StockRejected ends it (SET status = 'rejected' ... WHERE status = 'pending') and tells the customer. The WHERE status = ... guard means a late or duplicate outcome cannot move an order that has already moved on.
Kafka's idempotent producer removes duplicates the producer itself creates by retrying, but not the relay's publish-then-crash duplicate, which is a new send from the broker's view (Kafka 4.1 producer configs, enable.idempotence). Consumer-side dedup is still needed.
A saga chains these local transactions: order pending, then stock reserved, then payment charged, then order confirmed. If a step fails, earlier steps are undone by compensating transactions (release the stock, refund the charge). Compensation has limits. It is a new forward action, not a rollback, so other readers may already have seen the intermediate state (a "pending" order, briefly reserved stock); some effects cannot be undone at all (an email sent, a parcel shipped), so put them last; and compensations must themselves be idempotent and retried until they succeed. Without isolation between sagas, two concurrent ones can both read stock as available; guard it with a conditional update like the one above.
Detect trouble with three numbers. Orders pending longer than a few minutes catch a saga step that never answered. Age of the oldest unpublished event, SELECT now() - min(created_at) FROM outbox WHERE published_at IS NULL, alerts when the relay is stuck or slow; a steady rise means events are not leaving. Duplicate count, the rows where the dedup insert hit a conflict, shows how often redelivery happens; a sudden jump usually means relay crashes or a consumer rebalancing. Also delete or partition old published outbox rows, or the table and its index grow forever.
The MonolithFirst argument follows from this list: service boundaries are expensive to move once they are network calls with separate data, and a young product rarely knows its stable boundaries yet. Starting with one well-modularised app and splitting where the failure and team data show a need keeps that option open.
Worked example
The video's scenario in a few lines: an online shop's recommendations feature slows down, crashes in a loop, or gets redeployed. Does checkout keep taking orders? All hop, gateway and restart durations are assumed; this is a simulation, not a benchmark, and not Amazon's numbers.
setup (labs/sd-19, virtual clock, seed 19)
  200 req/s Poisson: checkout 40/s, search 80/s, recs 80/s
  mean service 21.2 / 10.6 / 15.9 ms; 16 workers in both designs
  monolith: one shared pool of 16       split: 4 / 6 / 6
  assumed hop 0.8 to 1.6 ms each way + 0.2 ms gateway; client timeout 1 s

normal day        checkout p50 20.14 vs 22.72 ms (+2.58)   p95 29.75 vs 32.34 ms
                  expected hop cost 0.2 + 1.2 + 1.2 = 2.6 ms

slow recs (2 s)   need 80 x 2 = 160 recs workers; have 16 shared or 6 own
                  checkout errors 97.5% vs 0.0%   orders/s 1.0 vs 39.7
                  split checkout p95 32.42 ms; recs fails 100% in both

crash loop        process up ≈ 62.5 ms of every 2,062.5 ms ≈ 3%
                  checkout errors 98.7% vs 0.0%   orders/s 0.5 vs 39.7
                  recs fails 100% in both

redeploy at 8 s   assumed 4 s whole app vs 1.5 s one service
                  expected 40 x 4 = 160; lab 157 failed checkouts (22.0%) vs 0
The split paid 2.6 ms per checkout and bought checkout's survival through every recs failure in the lab. Whether that is worth it depends on how often a feature fails and what the other costs above add up to for your team.
Code
First, the lab: one file, Node.js 22 standard library only, no install, no network, no files written. It ran in well under a second of real time on our machine.
# from the repository root
node labs/sd-19/run.mjs
It prints one row per scenario and design (checkout p50, p95, error rate, orders per second, recs error rate) and a final RESULT {...} JSON line. What to observe: the numbers repeat exactly because the seed is fixed, and recs errors stay at 100% in the slow and crash rows for both designs. Change slowRecsMs to 150 and the monolith's checkout errors fall back toward zero: 80 × 0.15 = 12 recs workers plus 1.7 for checkout and search is 13.7 of 16 on average, about 86% busy, so queues form in bursts but rarely reach the 1 s timeout.
Second, a bulkhead for a Node service (labs/sd-19/bulkhead.mjs). Each feature gets its own concurrency limit and a short queue; when both are full, calls are rejected at once. Two clocks matter and they are different:
- Caller deadline, started at enqueue: the longest the caller waits in all, queued or running. A queued entry that reaches it is removed and failed without ever getting a slot; a running call that reaches it fails the caller at once, whether or not the work has stopped.
- Execution timeout, started when the work gets a slot, capped by what is left of the deadline: the moment the work is told to stop.
Waiting, cancellation and resource release are three different things, and the code keeps them apart. An AbortController does not stop anything by itself. abort() only sets signal.aborted and fires the abort event (Node.js AbortController); the work stops only if it listens, as fetch, setTimeout from timers/promises and most Node I/O APIs that take a signal do. So the code below rejects the caller at its deadline (a race between the work and a deadline timer) but keeps the slot occupied until the work actually settles. Releasing the slot when the caller gives up would let new work start while the old downstream call still runs, and the limit would no longer limit anything.
// bulkhead.mjs: per-feature concurrency limits, a total deadline and an execution timeout, Node 22, no packages
class Bulkhead {
  constructor(name, maxActive, maxQueue) {
    Object.assign(this, { name, maxActive, maxQueue, active: 0, queue: [] });
  }
  async run(work, { deadlineMs, execTimeoutMs }) {
    const deadline = Date.now() + deadlineMs;                         // total budget starts at enqueue
    if (this.active < this.maxActive) this.active++;                  // free slot: take it
    else if (this.queue.length < this.maxQueue) {
      await new Promise((resolve, reject) => {                        // wait, but never past the deadline
        const entry = { resolve, timer: setTimeout(() => {
          this.queue.splice(this.queue.indexOf(entry), 1);
          reject(new Error(`${this.name}: deadline passed while queued`));
        }, deadlineMs) };
        this.queue.push(entry);
      });                                                             // resolved = the slot was handed to us
    } else throw new Error(`${this.name}: rejected, bulkhead full`);  // fail fast, hold nothing

    const ctrl = new AbortController();
    const budget = Math.max(0, Math.min(execTimeoutMs, deadline - Date.now()));
    const timer = setTimeout(() => ctrl.abort(), budget);             // abort only SIGNALS the work
    const settled = Promise.resolve().then(() => work(ctrl.signal)).finally(() => {
      clearTimeout(timer);                                            // the slot stays held until work settles
      const next = this.queue.shift();
      if (next) { clearTimeout(next.timer); next.resolve(); }         // hand the slot on
      else this.active--;                                             // or free it
    });
    let callerTimer;                                                  // the caller stops waiting at its deadline,
    const callerLimit = new Promise((_, reject) => {                  // even if the work ignores the abort
      callerTimer = setTimeout(() => reject(new Error(`${this.name}: caller deadline passed`)),
        Math.max(0, deadline - Date.now()));
    });
    try {
      return await Promise.race([settled, callerLimit]);
    } finally {
      clearTimeout(callerTimer);
    }
  }
}

// A downstream call that takes `ms`. A cooperative one stops when aborted; a stubborn one ignores the signal.
const call = (ms, cooperative) => (signal) => new Promise((resolve, reject) => {
  const t = setTimeout(resolve, ms);
  if (cooperative) signal.addEventListener('abort', () => { clearTimeout(t); reject(new Error('timeout')); });
}).then((v) => { if (signal.aborted) throw new Error('finished after the timeout'); return v; });

async function trial(label, poolFor, execTimeoutMs, cooperative = true) {
  const tally = { checkout: { ok: 0, fail: 0 }, recs: { ok: 0, fail: 0 } };
  const jobs = [];
  for (let i = 0; i < 60; i++) {                                      // 60 requests, one every 5 ms
    const type = i % 3 === 0 ? 'checkout' : 'recs';                  // 1 checkout per 2 recs
    const ms = type === 'recs' ? 2000 : 20;                           // recs is broken: 2 s per call
    jobs.push(poolFor(type).run(call(ms, cooperative), { deadlineMs: 1000, execTimeoutMs })
      .then(() => tally[type].ok++, () => tally[type].fail++));
    await new Promise((r) => setTimeout(r, 5));
  }
  await Promise.all(jobs);
  console.log(label.padEnd(40), `checkout ${tally.checkout.ok} ok ${tally.checkout.fail} failed | ` +
    `recs ${tally.recs.ok} ok ${tally.recs.fail} failed`);
}

const shared = new Bulkhead('shared', 16, 4);
await trial('A shared 16, 1 s exec timeout', () => shared, 1000);

const shortTimeout = new Bulkhead('shared', 16, 4);
await trial('B shared 16, 100 ms exec timeout', () => shortTimeout, 100);

const stubborn = new Bulkhead('shared', 16, 4);
await trial('C as B, but recs ignores the abort', () => stubborn, 100, false);

const pools = { checkout: new Bulkhead('checkout', 4, 4), recs: new Bulkhead('recs', 12, 4) };
await trial('D per-feature 4 + 12, 1 s exec timeout', (type) => pools[type], 1000);
Run it with node labs/sd-19/bulkhead.mjs. The expected counts, worked out from the timers (a slow or busy machine can drift the 5 ms spacing and move a count by one):
A shared 16, 1 s exec timeout            checkout 10 ok 10 failed | recs 0 ok 40 failed
B shared 16, 100 ms exec timeout         checkout 20 ok 0 failed | recs 0 ok 40 failed
C as B, but recs ignores the abort       checkout 8 ok 12 failed | recs 0 ok 40 failed
D per-feature 4 + 12, 1 s exec timeout   checkout 20 ok 0 failed | recs 0 ok 40 failed
What to observe. Recs fails everywhere, since a 2 s call cannot fit a 1 s deadline. In A, slow recs fills the 16 shared slots and the 4-entry queue within about 120 ms, and every later checkout is rejected. B cuts the execution timeout to 100 ms: recs arrive at about 133 per second, so they hold about 133 × 0.1 ≈ 13 slots, and checkout always finds one. Set it to 300 ms (133 × 0.3 ≈ 40 slots) and checkouts fail again. C is B with a recs call that ignores the signal: the timeout fires and each recs caller is failed at its 1 s deadline, but each slot stays held for the full 2 s, so the short timeout frees nothing and queued checkouts fail on their deadline instead of waiting forever. The caller is bounded either way; the capacity is bounded only by cooperative cancellation. D keeps the long timeout but gives checkout its own 4 slots, and checkout is untouched. No code in one process gives you the crash half: an uncaught fault that ends the process takes all pools with it.
Third, the process half, in Kubernetes. Each feature runs as its own Deployment, so its pods are separate processes with their own memory limits, restarts and rollouts. The liveness probe restarts a stuck container, the readiness probe keeps a pod out of rotation until it can serve, and the rolling update replaces pods only as fast as replacements become ready.
# recs-deployment.yaml (checkout gets its own Deployment, never shared)
apiVersion: apps/v1
kind: Deployment
metadata:
  name: recs
spec:
  replicas: 3
  selector:
    matchLabels: { app: recs }
  strategy:
    type: RollingUpdate
    rollingUpdate:
      maxUnavailable: 0        # the rollout itself never takes a pod away before its replacement is ready
      maxSurge: 1              # start one new pod at a time
  template:
    metadata:
      labels: { app: recs }
    spec:
      terminationGracePeriodSeconds: 30   # preStop + shutdown must fit in this before SIGKILL
      containers:
        - name: recs
          image: registry.example.com/shop/recs:1.4.2
          ports: [{ containerPort: 8080 }]
          resources:
            requests: { cpu: 250m, memory: 256Mi }
            limits: { memory: 512Mi }   # an out-of-memory kill stays inside recs
          readinessProbe:
            httpGet: { path: /ready, port: 8080 }
            periodSeconds: 2
            failureThreshold: 2
          livenessProbe:
            httpGet: { path: /healthz, port: 8080 }
            periodSeconds: 5
            failureThreshold: 3        # about 15 s of failed checks before a restart
          lifecycle:
            preStop:
              exec: { command: ["sleep", "5"] }   # assumed time for proxies to see ready: false; validate under load
What to observe. maxUnavailable: 0 limits what the rollout does: the controller does not scale old pods down below the desired count until new ones are ready. It is rollout-controlled availability, not a guarantee of serving capacity: a node failure, an eviction or a crash during the rollout still removes pods, and readiness only says the pod passed its probe.
Draining is the other half (pod lifecycle, termination). When a pod is deleted, the API server marks it terminating, and two things start in parallel. On the traffic side, the pod's EndpointSlice entries are not removed at once: they stay, with ready: false (and terminating: true), and kube-proxy, ingress controllers and service meshes stop sending new requests only as each one observes that change, after a delay nobody bounds. On the node, the kubelet runs the preStop hook first and sends SIGTERM only after the hook finishes; the hook's time counts against terminationGracePeriodSeconds, and SIGKILL follows when the period runs out (if the hook itself overruns, the kubelet allows a one-off 2 s extension). Here the 5 s sleep leaves about 25 s of the 30 s for the app to shut down. The 5 s is an assumed propagation allowance, not a guarantee: validate it under load by checking that no new requests reach the pod after SIGTERM (connection resets or 502s at the proxy during a rollout are the symptom), and raise it if they do. On SIGTERM the app should stop accepting new connections, close idle keep-alive connections, finish in-flight requests, then exit.
If recs crashes on every request, its pods go into CrashLoopBackOff, and kubectl get pods shows recs restarts climbing while checkout's stay at zero. The back-off grows exponentially, by default from 10 s up to a 5 minute cap, resetting after the container runs cleanly for 10 minutes; recent Kubernetes versions let cluster operators tune these values, so check your cluster's kubelet configuration rather than assuming them.
Fourth, the caller side. A proxy such as Envoy enforces limits per upstream cluster; its circuit breaking settings are bulkheads that fail new requests to that cluster at once past the limit. This is a cluster fragment, not a full config: it still needs a listener, a route and endpoints (a load_assignment or service discovery) for recs.
# fragment: envoy cluster for recs; add load_assignment or EDS endpoints
# written against the Envoy 1.41 docs; overflow counters differ in older releases
clusters:
  - name: recs
    connect_timeout: 0.25s
    circuit_breakers:
      thresholds:
        - priority: DEFAULT
          max_connections: 64        # HTTP/1.1 limit; HTTP/2 multiplexes on few connections
          max_pending_requests: 16   # short queue, then fail fast
          max_requests: 64           # outstanding requests to recs (the HTTP/2 limit)
          max_retries: 2             # outstanding retries across the cluster, not attempts per request
Three details change how these numbers behave in production:
- Limits are per Envoy instance and not coordinated. Each sidecar or proxy counts only its own traffic. Ten proxies each configured with
max_requests: 64can send about 640 concurrent requests to recs collectively. Size the per-proxy value from what recs can take divided by the number of callers, and revisit it when callers scale out. - Connections and requests are different limits. With HTTP/1.1 a connection carries one request at a time; Envoy reuses idle pooled connections for later requests, so connections are not opened per request, but concurrent requests need concurrent connections, and
max_connectionscaps HTTP/1.1 concurrency. With HTTP/2 many requests share a connection, somax_connectionshardly matters andmax_requestsdoes the bulkhead work. max_retriesis not a retry count. It caps how many retries can be outstanding at once across the cluster. How many times one request is retried is set on the route, inretry_policy.num_retries, together withper_try_timeoutand the conditions inretry_on.
Detect overflow from Envoy's cluster stats, and pin the Envoy version you read them for, because the counters changed. In the current documentation (the 1.41 development docs at the time of writing), hitting max_pending_requests increments upstream_rq_pending_overflow and hitting max_requests increments upstream_rq_active_overflow. Older releases counted both in upstream_rq_pending_overflow, and the runtime flag envoy.reloadable_features.skip_pending_overflow_count_on_active_rq set to false keeps that legacy behaviour for existing dashboards. An alert on the pending counter alone can therefore miss request-limit overflow: check the circuit-breaking page for your version and alert on both counters where they exist, plus upstream_cx_overflow, upstream_rq_retry_overflow, and the gauges under circuit_breakers.default.*_open that show which breaker is currently tripped. Alert on the rate of overflow, since a non-zero value means the proxy is shedding load for that upstream.
Pair it with a per-route timeout well under the client's. In a JVM service, Resilience4j's bulkhead offers both shapes: a semaphore bulkhead (maxConcurrentCalls, maxWaitDuration) and a thread pool bulkhead with its own threads and queue.
Failure modes and edge cases
A synchronous call carries the failure across. In the lab, checkout never calls recs. If it waited on recs, slow recs would hold checkout's 4 workers as it held the monolith's 16, and the split would buy nothing. Every cross-service call needs a timeout shorter than the caller's own deadline, a bulkhead on the caller's side, a circuit breaker that stops calling a failing service, and a fallback (show the page without recommendations). Better still, keep non-essential calls off the critical path entirely.
Retries multiply load on the thing that is already failing. If the gateway retries recs three times, a slow recs sees up to four times the traffic. The Google SRE chapter on cascading failures treats this as a main way outages spread; use retry budgets, backoff with jitter, and retries at one layer only.
Shared resources hide under the split. Services sharing one database, cache cluster or node are still one failure domain for it: a recs query that holds locks or saturates the database slows checkout too. Give every shared resource per-service limits, or split it.
Poison requests through every replica. A request that crashes its handler crashes each replica it is sent to. Detect it by correlating crashes with request attributes; contain it with per-feature processes and, at scale, by routing each customer to a fixed subset of replicas.
Health checks that test the wrong thing. A liveness probe that calls the database restarts every pod when the database is slow. Liveness should check only that the process can respond; readiness may check dependencies.
Too many small services. A page that needs a long chain of synchronous calls gets the product of their availabilities and the sum of their latencies. Find it with traces; merge services that always change and fail together.
Trade-offs
| Option | Good for | Costs you | Use when |
|---|---|---|---|
| Monolith, one shared pool | Simplicity, in-process calls, one database transaction, one deploy | No isolation: slow recs failed 97.5% of checkouts, a crash loop 98.7%, a 4 s redeploy 157 checkouts in our lab | Early products, small teams, features that rarely fail independently |
| Monolith with bulkheads and timeouts | Containing slow dependencies without a network hop | Tuning pool sizes and timeouts; no protection from crashes or memory leaks; deploys still restart everything | Most of the risk is slow external calls |
| One codebase, separate deployments per feature | Process isolation for crashes and deploys while sharing code and tooling | More deployments to run; still tempting to share one database | A step toward services when boundaries are still moving |
| Microservices | Crash, deploy and team isolation; scaling each feature on its own | A hop per call (about 2.6 ms in our assumptions), distributed data, tracing, more pipelines and on-call | Several teams, features with very different load or failure profiles, stable boundaries |
| Microservices calling each other synchronously | Simple request and response code | Failures cross service lines unless every call has timeouts, breakers and fallbacks; availability multiplies down | The answer is truly needed to finish the request |
Common mistakes
In an interview
- Clarify: team count, release frequency, which features are critical (checkout) and which optional (recommendations).
- Assumptions: a shop at a few hundred requests per second, one critical write path, several read-heavy features.
- Structure: gateway, checkout with its own data, optional features as services called with timeouts and fallbacks.
- Deep dive: Little's law for pool saturation (80 × 2 s = 160 workers vs 16); bulkheads for slow calls, process separation for crashes; rolling deploys.
- Trade-offs: a hop per call, distributed data and transactions, tracing and on-call costs, availability multiplying across synchronous calls when their failures are independent (correlated failures need the joint probability).
- Wrap up: start modular, split critical paths away from risky features first, limit every call that crosses a boundary.
A monolith whose features share one process and one pool of workers, like the one in my simulation, lets one bad feature take every feature down. If recommendations get slow, its calls hold the shared workers: at 80 requests per second and 2 seconds each, Little's law says it needs 160 workers, so a 16-worker pool fills in a fifth of a second and checkouts time out in the queue. In a small simulation that failed 97.5% of checkouts; split into services with their own workers, 0%. Per-feature pools inside the monolith fix the slow case, but not a crash, which ends the process and every feature in it; separate services contain that, though shared databases and synchronous calls between services can still carry failures across. The cost was about 2.6 ms of hop per request there, plus more deploys, monitoring, tracing and split data. So I start modular, put timeouts and bulkheads on every dependency, and split out the features whose failures or teams need their own process.
Practice
BeginnerWhat does a monolith share that microservices do not?
One process (memory, workers, connection pools), one deploy, and usually one database. Services each have their own process and deploy, and usually their own data. A monolith can still partition its workers with bulkheads; the lab's monolith did not, which is why one feature could exhaust them all.
IntermediateRecs gets 80 requests per second and each now takes 2 s. How many workers does it need, and how fast does it fill a pool of 16?
By Little's law 80 × 2 = 160 busy workers. At 80 new calls per second it fills 16 workers in 16 / 80 = 0.2 s.
IntermediateWhy did checkout keep 0.0% errors in the split version when recs was slow?
Checkout had its own 4 workers that recs could never take. It needs about 40 × 21.2 ms ≈ 0.85 of them, so it ran as on a normal day while recs failed 100% with its 6.
AdvancedWould per-feature thread pools inside the monolith have saved checkout in the crash loop?
No. Pools divide workers within one process; a crash ends the process and all pools with it. The monolith was up only about 62.5 ms of every 2,062.5 ms cycle, about 3%, and the lab measured 98.7% checkout errors. Only separate processes contain a process-fatal fault, and only for the resources they do not share (host memory without limits, a database, data formats).
AdvancedIn a shared pool of 16, checkout (40/s × 21.2 ms) and search (80/s × 10.6 ms) keep their normal load while recs (80/s) turns slow. Above what recs timeout does the pool saturate on average, and is that a safe setting?
Other load = 40 × 0.0212 + 80 × 0.0106 = 1.696 workers, so recs may hold 16 − 1.696 = 14.304, and the boundary is 14.304 / 80 ≈ 178.8 ms, assuming cancellation really frees the worker. It is not safe: it is a mean-load boundary at about 100% utilisation, so bursts queue without limit and it promises no latency. Choose a timeout well below it, bound admission with a bulkhead, and measure queue wait.
AdvancedCheckout now calls recs synchronously with a 1 s timeout and recs takes 2 s. What happens, and what do you change?
Each checkout holds a worker for the full 1 s: 40 × 1 s = 40 workers against 4, so checkout fails although it is a separate service. Use a short timeout, a circuit breaker and a fallback without recommendations, or take the call off the checkout path.
AdvancedA redeploy of the whole app takes an assumed 4 s at 40 checkouts per second. Estimate the lost orders and name two ways to avoid them without splitting.
About 40 × 4 = 160; the lab counted 157. Rolling updates with readiness checks keep old copies serving until new ones are ready, and draining connections before stopping a copy finishes in-flight work.
Cheat sheet
| Term or formula | Meaning |
|---|---|
| Monolith | All features in one deployable unit, sharing one process's resources |
| Microservices | Features as separately deployed services talking over the network |
| Little's law | L = λW; busy workers = arrivals per second × seconds held |
| Pool saturation | λ × W > workers means arrivals outpace completions and a backlog builds until timeouts or shedding remove work; 80 × 2 s = 160 > 16 |
| Time to fill a pool | rough estimate: workers / arrival rate of the slow calls; 16 / 80 ≈ 0.2 s (Poisson bursts and busy workers change it) |
| Timeout stability boundary in a shared pool | (workers − other load) / slow-call rate; (16 − 1.696) / 80 ≈ 178.8 ms; a mean-load limit, not a safe value |
| Bulkhead | A fixed share of workers or connections per feature; contains slow calls |
| Process isolation | Separate processes per feature; contains process-fatal faults, but not shared host memory, databases or data changes |
| Outbox | Write the event in the same transaction as the data; the relay delivers at least once, so consumers dedupe by event ID |
| Circuit breaker | Stops calling a failing dependency for a while, fails fast, then probes |
| Hop cost | gateway + hop there + hop back; 0.2 + 1.2 + 1.2 = 2.6 ms assumed |
| Redeploy loss | rate × restart time; 40 × 4 s = 160 (lab 157) |
| Series availability | A₁ × A₂ × ... if failures are independent; five at 99.9% = 0.99500999 ≈ 99.501%; correlated failures need the joint probability |
| Crash loop up fraction | time to next crash / (that + restart); 62.5 / 2,062.5 ≈ 3% |
Further reading
- ACM Queue (2006), Learning from the Amazon technology platform: the move from one monolithic application to services that own their data, and a gateway page calling more than 100 services.
- martinfowler.com, Microservices: the widely cited description of the style: services as components, decentralised data, design for failure.
- martinfowler.com, MonolithFirst: why many service architectures started as a monolith, and why early boundaries are hard to get right.
- Azure Architecture Center, Bulkhead pattern: partitioning resources per consumer or dependency, and how to size the partitions.
- Azure Architecture Center, Circuit Breaker pattern: the closed, open and half-open states that stop a failing dependency from holding callers.
- Google SRE book, Addressing Cascading Failures: how overload spreads, and the defences: load shedding, retry limits, deadlines.
- PostgreSQL, Explicit locking (row-level locks): why
FOR UPDATElocks last until the transaction ends, which is what makes an outbox relay's claim hold.
This article describes general monolith and microservice patterns, public documentation, a public 2006 interview, and our own simulation. It does not describe any company's private systems, and the diagrams are conceptual. Every lab number comes from a discrete-event simulation on a virtual clock with one seed (19), in which the network hop, gateway work and restart durations are assumed inputs; it is not a benchmark, not a measurement of any real system, and not Amazon's numbers.
Frequently asked questions
What is the difference between a monolith and microservices?
A monolith runs every feature in one deployable program, usually one process type sharing one pool of workers and one database. Microservices split features into separately deployed services that talk over the network, each with its own resources and usually its own data. The split trades a network hop and more operational work for isolation and independent deploys.
Do microservices make an app faster?
No, usually a little slower per request. In our simulation the split version's checkout p50 was 22.72 ms against 20.14 ms in one app, a 2.58 ms cost that matches the assumed hop and gateway time. What the split bought was isolation: when another feature broke, checkout kept working.
Can a monolith get the same isolation without splitting?
Partly. Separate worker or connection pools per feature (bulkheads) and short timeouts stop one slow feature from holding every worker. They do not stop a crash: if one code path kills the process, every feature in that process goes down with it. Running features as separate processes, even from one codebase, is what contains crashes.
Why did Amazon move from a monolith to services?
In the 2006 ACM Queue interview, Amazon's CTO described Amazon.com starting as one monolithic application and moving to services that each own their data behind an interface, with small teams building and running their own service. He said the Amazon.com gateway page calls more than 100 services. This article does not describe Amazon's internal systems beyond that interview.
If checkout calls recommendations directly, does splitting still help?
Not on its own. A synchronous call carries the failure across the network: checkout waits for the slow service and holds its own workers. You also need a short timeout on the call, a circuit breaker that stops calling a failing service, and a fallback such as showing the page without recommendations.
Are these numbers measured on real servers?
No. They come from our discrete-event simulation on a virtual clock with one seed (19). The network hop, gateway work and restart durations are assumed, not measured. The lab shows the shape of the effect under stated assumptions; it is not a benchmark and not any company's figures.
Sources
- ACM Queue (2006): Learning from the Amazon technology platformqueue.acm.org
- martinfowler.com: Microservices, a definition of this new architectural termmartinfowler.com
- martinfowler.com: MonolithFirstmartinfowler.com
- Azure Architecture Center: Bulkhead patternlearn.microsoft.com
- Azure Architecture Center: Circuit Breaker patternlearn.microsoft.com
- Google SRE book: Addressing Cascading Failuressre.google
- PostgreSQL: Explicit locking, row-level lockspostgresql.org

Written by a software engineer and system architect with 10+ years of building production web, payment, ticketing and accounting systems in Japan and Nepal. About us