System DesignSystem Design, simply · Part 3
Design Instagram's feed: system design in five steps
System design as engineering, on a news feed: API, data model, fan-out on read vs write with cost formulas, Redis timelines, cursors, hot keys and a benchmark.
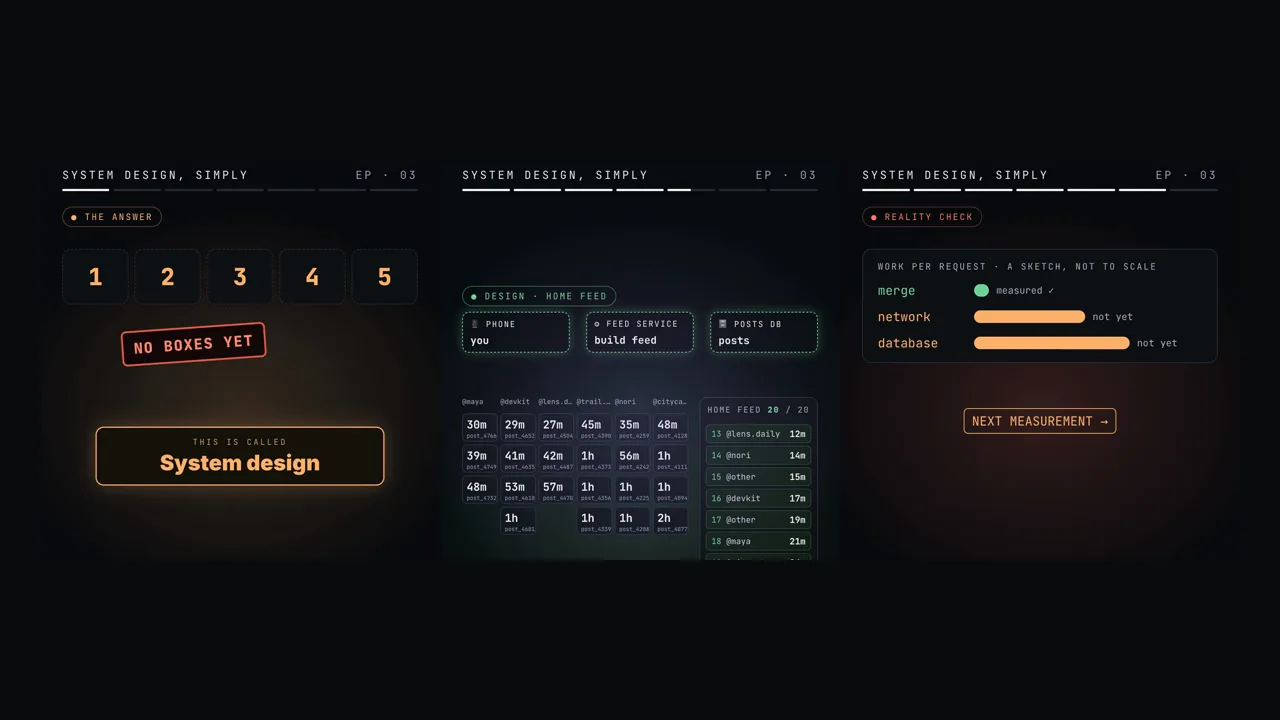
 Video · 60 secondsWatch the short versionSame diagrams and numbers. Tap to play.
Drafted with AI assistance, then checked and edited by a human engineer · How we write
Short answer
System design is turning requirements and load into an API, a data model and an architecture whose costs you can compute, then measure. For a feed of 20 posts from 150 follows at an assumed 35,000 loads a second, fan-out on read costs about 5.25 million list reads a second; fan-out on write costs about 52,000 timeline inserts, plus a read-time merge for very large accounts.
| Process | Requirements · estimates · API · data model · high-level design · deep dive · measure |
|---|---|
| Assumed load | 100M users × 10 loads ÷ 86,400 × 3 ≈ 34,722 ≈ 35,000 feeds/s; about 347 posts/s; 100 reads per post |
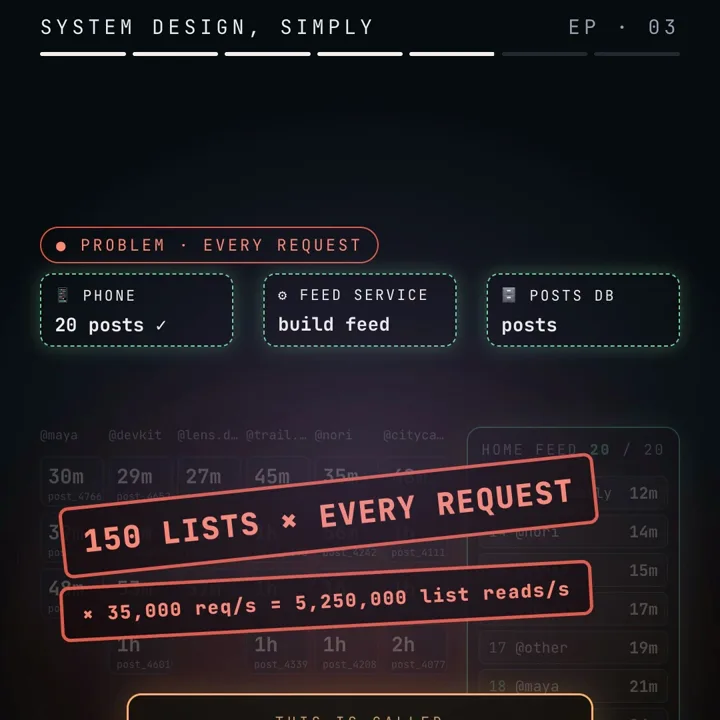
| Fan-out on read | k-way merge O(k + n log k) per feed, but 150 list reads each: 150 × 35,000 = 5,250,000 reads/s |
| Fan-out on write | Write amplification = followers per post: 347 × 150 ≈ 52,083 inserts/s, then one range read per feed |
| Timeline store | Redis sorted set per user: ZADD, ZRANGE REV, ZREMRANGEBYRANK to cap length; (time, id) cursor |
| Tail | 1 − 0.99^150 ≈ 77.9% of pulled feeds wait on at least one read beyond its p99 |
| Measured | 73,526 feeds/s on one core, merge only and in memory, 7.35× the 10,000/s guess |
A home feed must return the newest posts from every account a user follows, in time order, within a latency budget, while reads outnumber posts by about a hundred to one. The design question is where the work of merging those posts happens: on every read, on every write, or split between the two, and what each choice costs in operations, memory and tail latency. Interview question: "Design the home feed of a photo app for 100 million daily users."
Prerequisites
Requests per second and peak load. Capacity is planned for the busiest second: divide a daily count by 86,400, then multiply by a stated peak factor, as in the ticket sale spike that separates performance from scalability.
Big-O cost. O(log N) means the work grows with the logarithm of the input size: doubling N adds one step. It says how cost scales, not how long it takes.
Binary heap. An array kept as a tree where each parent is no larger than its children. Peek is O(1), pop and push are O(log k), building from k items is O(k).
Definitions
System design: deciding the components, their interfaces and where data lives, so the system meets stated requirements at a stated load.
Functional and non-functional requirements: what a user can do (post, follow, read) versus how well it must be done (latency, availability, freshness, scale).
Timeline: the ordered list of post ids a feed is built from, computed per request or stored per user.
Fan-out on read (pull): build the feed at request time by reading the recent posts of every followed account and merging them.
Fan-out on write (push): when a post is published, insert its id into the stored timeline of every follower, so a feed read is one range lookup.
Write amplification: storage writes caused by one logical write; under push, the author's follower count.
Cursor pagination: each page returns an opaque token naming the last item served; the next request asks for items strictly after it.
Percentile latency (p50, p99): the latency that 50% or 99% of requests are at or below.
How it works: the design process
System design is an engineering loop: what must it do, how well, how much, draw it, measure it. "Draw it" is four artefacts: an API, a data model, a high-level architecture and a deep dive on the one part the numbers say is hard.

1. Requirements
Functional: publish, follow and unfollow, read the newest posts from followed accounts in reverse time order, 20 per page; stories, likes and search are out of scope. Non-functional (assumed): feed p99 under 200 ms at the server, a new post visible within a few seconds, and the feed readable while the write path is degraded, which ranks availability above freshness. Testable targets are covered in turning functional and non-functional requirements into SLOs.
2. Estimates
With the assumed inputs of the worked example, the peak is about 35,000 feed reads and 347 posts a second. The ratio, about 100 reads per post, is the most important number in this design: it says the expensive work should move to the rarer operation.
3. API
GET  /v1/feed?limit=20&cursor=<opaque>
     200 {"items": [{"post_id": "...", "author": {...}, "created_at": "...",
                     "caption": "...", "media_url": "..."}],
          "next_cursor": "eyJ0cyI6MTcwMDAwMDAwMDAwMCwiaWQiOjQyfQ"}
POST /v1/posts                      201 {"post_id": "..."}
PUT  /v1/users/{id}/following/{author_id}     204
DELETE /v1/users/{id}/following/{author_id}   204
The cursor is opaque (base64 of a timestamp and id) so its encoding can change; limit is capped server side; the response carries hydrated posts, so the phone makes one round trip.
4. Data model
posts     (post_id BIGINT PRIMARY KEY, author_id BIGINT, created_at TIMESTAMPTZ,
           caption TEXT, media_key TEXT, deleted_at TIMESTAMPTZ NULL)
           INDEX (author_id, created_at DESC, post_id DESC)
follows   (follower_id BIGINT, followee_id BIGINT, created_at TIMESTAMPTZ,
           PRIMARY KEY (follower_id, followee_id))
           INDEX (followee_id, follower_id)      -- "who follows X", for fan-out
timeline  Redis sorted set  timeline:{user_id}
           member = post_id, score = created_at in milliseconds   -- derived, rebuildable
Posts and follows are the source of truth; the timeline is derived data that can always be rebuilt from them. It stores ids, not content, so an edit needs no fan-out; the read path hydrates 20 ids in one multi-get. The follow graph is indexed both ways: "whom do I follow" for pull, "who follows this author" for push.
5. High-level design and 6. deep dive
Read path: client, load balancer, feed service, timeline store, post cache. Write path: post service, queue, fan-out workers, timeline store. The deep dive is the fan-out between them, where the estimates put almost all of the cost; the next three sections are that deep dive.
7. Measure
Every cost above is a model. The last step replaces guessed costs with measured ones, one component at a time, and revises the design when a number moves.
Fan-out on read vs fan-out on write: the cost model
Fan-out on read: a k-way merge per request
Each author's posts are sorted newest first by the (author_id, created_at DESC) index, so a feed is a k-way merge of k sorted lists, k being the follow count.
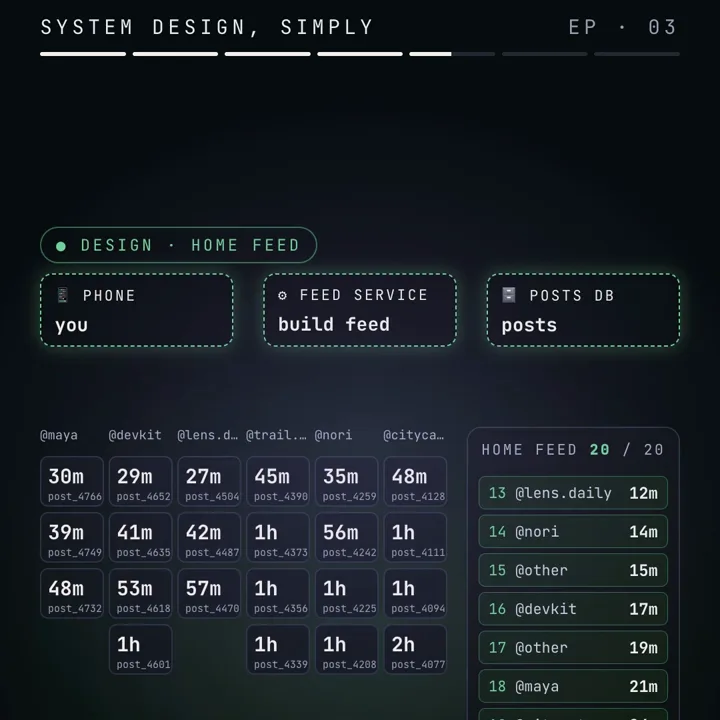
Merging all N items of k lists costs O(N log k). A feed needs only the top n, so the merge stops early: O(k) to build the heap plus n pops and pushes at O(log k) each, O(k + n log k) in total. With k = 150 and n = 20, log₂ 150 ≈ 7.2, so the merge is roughly 150 + 2 × 20 × 7.2 ≈ 439 elementary heap steps, against sorting all 150 × 20 = 3,000 candidate posts. The CPU is cheap; the cost is k separate list reads per feed, each a storage or cache round trip.
Fan-out on write: write amplification
Under push, a post is inserted into each of the author's f timelines: write amplification is f. An insert into a sorted set of length L is O(log L), so one post costs O(f log L); a feed read is one range query, O(log L + n).
The cost formulas and the crossover
Let R be feed reads per second, W posts per second, F the average follows per user and f̄ the average followers per author. Every follow edge has one follower and one followee, so across the whole graph f̄ = F. Counting storage operations per second:
fan-out on read    cost_read  = R × F × c_list  +  W × c_post
fan-out on write   cost_write = W × f̄ × c_ins  +  R × c_range

with f̄ = F, c_range ≈ c_list and c_post ignored, push wins when
   W × F × c_ins  <  R × (F − 1) × c_list
   R / W  >  (F / (F − 1)) × (c_ins / c_list)  ≈  c_ins / c_list   (F large)
Here c is the cost of one operation of each kind: push wins whenever reads per post exceed the cost of an insert relative to a list read. With R / W ≈ 100 and similar unit costs, push does about 52,083 inserts plus 34,722 range reads a second, about 86,805 operations, against about 5.2 million list reads: roughly 60 times fewer. Where reads and writes are close, the simpler pull model wins.
The per-author view makes this clearer. An author with f followers posting p times a day costs p × f inserts a day under push; under pull, f followers reading r times a day cost f × r list reads. Push wins when p × c_ins < r × c_list, and f cancels out. Follower count therefore has no say in which model does fewer operations, only in the shape of the work.
Timeline storage: Redis sorted sets and cursors
The commands
A Redis sorted set holds unique members, each with a floating-point score, kept in score order. Redis implements it as a skip list plus a hash table, so an add is O(log N) and a range read needs no sort. One key per user, member = post id, score = creation time in ms:
# redis-cli
ZADD timeline:42 1700000000123 9001          # O(log N): insert, or update the score
ZREMRANGEBYRANK timeline:42 0 -501           # keep only the newest 500 (ranks are ascending)
ZRANGE timeline:42 0 19 REV WITHSCORES       # newest 20; same as the older ZREVRANGE
ZRANGE timeline:42 (1700000000123 -inf BYSCORE REV LIMIT 0 20   # next page after a cursor
ZRANGE is O(log N + M) for M returned elements; since Redis 6.2 its REV and BYSCORE options replace the deprecated ZREVRANGE and ZREVRANGEBYSCORE. ZREMRANGEBYRANK with ranks 0 to -501 deletes everything except the 500 highest scores, which caps the timeline length. A worker pipelines both per follower, so the cap holds on every insert.
Watch the precision of scores. They are IEEE 754 doubles, exact for integers only up to 2⁵³ ≈ 9.0 × 10¹⁵. A millisecond timestamp (about 1.7 × 10¹²) fits; a 64-bit time-ordered id does not, and ids above 2⁵³ collapse onto neighbours. Keep the id as the member.
Memory estimate
raw post ids only          100,000,000 users × 500 × 8 B    =   400 GB
id + score                 100,000,000 × 500 × 16 B         =   800 GB
skip list encoding         100,000,000 × 500 × ~80 B (assumed per-entry overhead)
                                                            = 4,000 GB
compact listpack, cap 128  100,000,000 × 128 × ~20 B (assumed)
                                                            =   256 GB
Redis stores small sorted sets in a compact listpack while they stay under zset-max-listpack-entries (128 by default) and zset-max-listpack-value (64 bytes); above that it converts to the skip list. So the cap is a memory lever with a step in it: 500 forces the larger encoding, 128 keeps the compact one. Check the assumed per-entry figures with MEMORY USAGE timeline:42. A second lever: keep timelines only for recently active users and rebuild the rest with one pull merge.
Cursor pagination vs offset
Offset pagination (LIMIT 20 OFFSET 1000) has two defects. Cost: PostgreSQL still computes the rows OFFSET skips, so page 51 reads 1,020 rows to return 20. Correctness: if 3 posts arrive at the head between pages, offset 20 points 3 items earlier and you see 3 duplicates.
A cursor names the last item served; in SQL it is a row comparison the index answers directly:
SELECT post_id, created_at FROM posts
WHERE author_id = $1 AND (created_at, post_id) < ($ts, $id)
ORDER BY created_at DESC, post_id DESC LIMIT 20;
Each page is O(log N + n) at any depth, and new posts cannot shift it. Ties need care: Redis orders equal scores by member bytes, so a score-only cursor with an exclusive bound can skip a post from the same millisecond. Put score and id in the cursor, use an inclusive bound and drop ids at or before the cursor's.
The hybrid, hot keys and invalidation
Why large accounts break pure push
Follower count cancels out of the total, not out of latency. One post by a 50,000,000-follower account is 50,000,000 inserts into 50,000,000 keys, all due at once. At the assumed peak insert rate of 52,083 a second that is 50,000,000 ÷ 52,083 ≈ 960 seconds of fan-out capacity: the last followers see it about 16 minutes late, and ordinary posts queue behind it.
The hybrid
Push for authors below a follower threshold (assumed 100,000), pull above it. A read is one range read of the stored timeline merged with the recent posts of the few large accounts followed (say 5, assumed): the same k-way merge with k = 6 instead of 150. Pick the threshold so that f ÷ (insert rate available to one post) stays within the freshness target. Public talks on timeline systems describe this shape, including the one in Further reading.
Hot keys
Pulling moves the load from many keys to one. If those 50,000,000 followers load the feed 10 times a day (assumed): 50,000,000 × 10 ÷ 86,400 × 3 ≈ 17,361 reads a second at peak on one key and one shard. Fixes: an in-process cache in each feed server (assumed 200 servers, 1 second TTL: at most about 200 shard reads a second), with request coalescing so only one request refills an expired entry, or replicas of the key read in turn, the idea behind scaling out behind a load balancer applied to one key. A pulled list is the same for every reader, so it caches well; per-user timelines cannot be shared.
Invalidation: deletes, unfollows, privacy
Any change to posts, follows or privacy can leave a timeline stale, and fanning a delete out costs the same amplification as the post. So the read path is the authority:
- Delete or edit. Hydration drops ids whose post has
deleted_atset; edits appear for free. A later ZREM only tidies the timeline; correctness does not depend on it. - Unfollow. Filter items against the current follow set at read, and let a worker remove that author's ids from one timeline.
- Follow. Backfill the author's newest ids with ZADD on the follow event.
- Block or private. Read-time filtering is mandatory: a stale entry here is a privacy leak.
A worker can insert a post just after an unfollow cleaned the timeline; the read filter makes that race harmless. Where a race must never give a wrong answer, such as a seat sold twice, you need an atomic conditional write, as in the race condition between two fans and one seat.
Ranking as a separate stage
A ranked feed keeps this pipeline as candidate generation (the newest 500 ids) and adds a scoring stage that ranks them and returns 20. The cursor then names a ranked snapshot, not a timestamp, and scoring needs its own latency budget; fan-out does not change.
Measuring: method, percentiles and the tail
Method
A benchmark is evidence only if its method is stated. The lab behind this article (labs/sd-3/run.mjs): write the guess down first (150 list heads at about 0.5 µs plus about 25 µs of JSON, rounded to 100 µs, so 10,000 feeds a second); fix the data from a seed (10,000 users, 20 posts and 150 follows each); check the heap result against a full sort; warm up 1.5 seconds so the JIT compiles the hot path; loop the handler for 4 seconds on one core and count; record the machine (Apple M2 Pro) and runtime (Node.js 22.13.1).
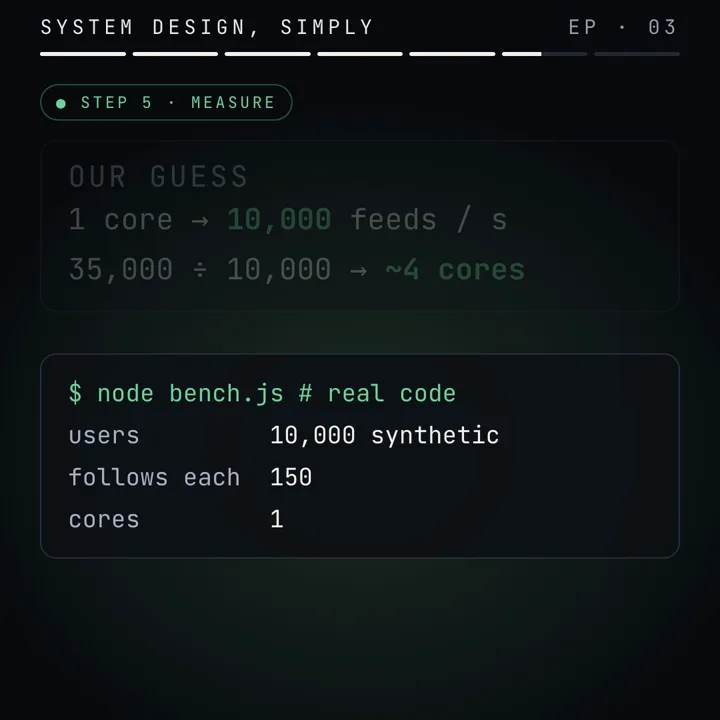
The run gave 73,526 feeds a second, 1,000,000 ÷ 73,526 ≈ 13.6 µs per feed, or 7.35 times the guess. That error is on the safe side, but it is outside the factor of 3 an estimate is allowed. Intuition is weakest at micro-costs like these, so they need a run.
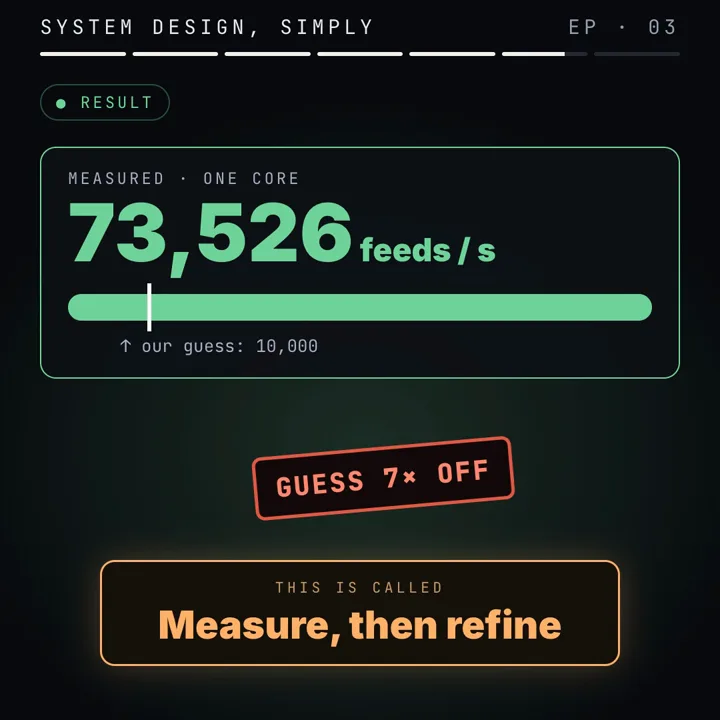
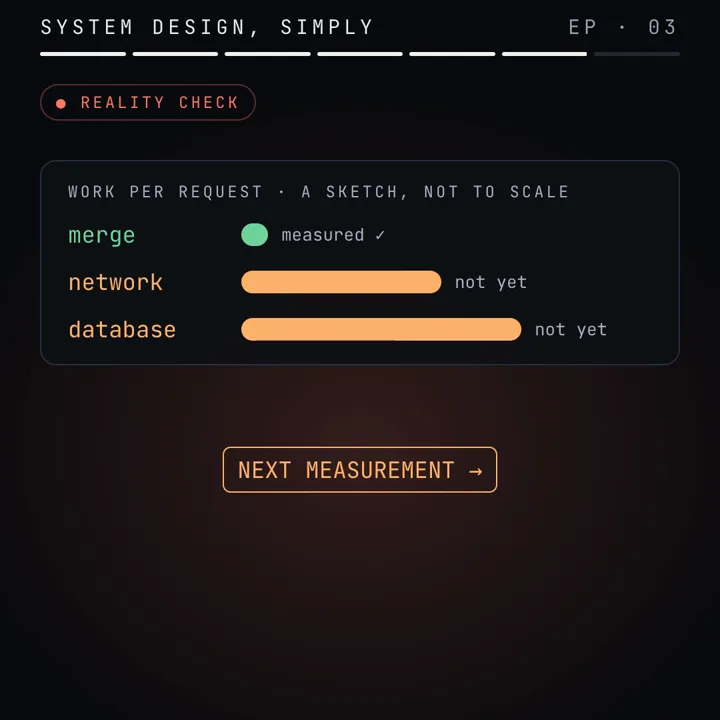
Scope is part of the result: merge and serialisation only, in memory, with no HTTP, TLS, network or storage. The conclusion is narrow: the merge is not the bottleneck; measure storage reads next.
Throughput is not latency: utilisation and queueing
A per-core rate measures capacity; response time also includes waiting in a queue. In the simplest queueing model (M/M/1: random arrivals, one server, exponential service times), mean response time is S ÷ (1 − ρ), where S is the service time and ρ the utilisation. With S = 13.6 µs: 27.2 µs at ρ = 0.5, 68 µs at 0.8, 136 µs at 0.9. Waiting grows without bound as ρ approaches 1, so plans size for about 50% utilisation; the lab also simulates a queue in front of the handler and reports p50 and p99 as load rises. Applying the lab's sizing rule of 50% utilisation: 34,722 ÷ (73,526 × 0.5) ≈ 0.94 cores of this handler at peak, against 34,722 ÷ (10,000 × 0.5) ≈ 6.94 from the guess.
p99 and fan-out: the tail at scale
A feed that waits for 150 list reads is as slow as the slowest of them. If each read independently has a 1% chance of exceeding its own p99, the chance that at least one of 150 does is 1 − 0.99¹⁵⁰ ≈ 77.9%. This effect, described in "The Tail at Scale", is a second argument for push: one read instead of 150. Where fan-out is unavoidable, use hedged requests (send a duplicate after the p95 delay, take the first answer) or serve partial results.
Worked example
The scenario from the video: a photo app, you follow 150 people, and opening the app shows the 20 newest posts from them. All inputs are assumed for teaching; none are any company's real traffic.
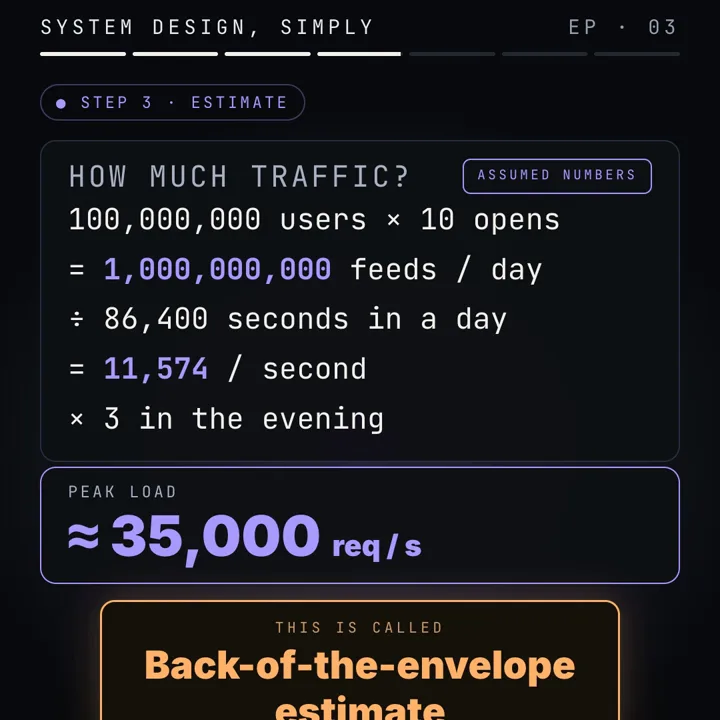
ASSUMED   100,000,000 daily users · 10 feed loads each · peak 3× average
          150 follows each (so 150 followers on average) · 20 posts per page
          1 user in 10 posts once a day · timeline cap 500 · large account 50,000,000

reads     100,000,000 × 10                    = 1,000,000,000 feeds a day
          1,000,000,000 ÷ 86,400              ≈ 11,574 per second
          11,574 × 3                          ≈ 34,722 ≈ 35,000 per second at peak
posts     100,000,000 ÷ 10                    = 10,000,000 a day
          10,000,000 ÷ 86,400 × 3             ≈ 347 per second at peak
ratio     34,722 ÷ 347.2                      = 100 reads per post

pull      150 × 35,000                        = 5,250,000 list reads/s
          (150 × 34,722 unrounded             ≈ 5,208,333)
push      347.2 × 150                         ≈ 52,083 inserts/s
          plus 34,722 range reads/s
merge     log2(150) ≈ 7.2;  150 + 2 × 20 × 7.2 ≈ 439 heap steps, not a 3,000-post sort

big post  50,000,000 ÷ 52,083                 ≈ 960 s of peak fan-out
hot key   50,000,000 × 10 ÷ 86,400 × 3        ≈ 17,361 reads/s on one key
tail      1 − 0.99^150                        ≈ 77.9% of pulled feeds hit a slow read

MEASURED  73,526 feeds/s on one core (merge only, in memory)
          1,000,000 ÷ 73,526                  ≈ 13.6 µs per feed
          73,526 ÷ 10,000                     ≈ 7.35 × the guess
          34,722 ÷ (73,526 × 0.5)             ≈ 0.94 handler cores at 50% busy
Conclusion from the numbers: CPU for the merge is negligible; 5.25 million storage reads a second and a 77.9% tail exposure are not. Push for ordinary authors, pull for the few huge ones, and measure storage next.
Code
All three programs use only the Python standard library. First, fan-out on read: the early-stopping k-way merge with heapq, checked against a full sort. Save as feed.py and run python3 feed.py.
import heapq
import random
from itertools import islice

random.seed(42)

# Synthetic data: 1,000 users, 20 posts each, 150 follows each.
USERS, POSTS_EACH, FOLLOWS_EACH, FEED_SIZE = 1_000, 20, 150, 20

# timeline[user] = that user's own posts, NEWEST FIRST: (timestamp, post_id)
timeline = {}
for u in range(USERS):
    posts = [(random.randint(0, 604_800), f"p{u}_{k}") for k in range(POSTS_EACH)]
    posts.sort(reverse=True)            # newest first
    timeline[u] = posts

follows = {u: random.sample([v for v in range(USERS) if v != u], FOLLOWS_EACH)
           for u in range(USERS)}


def home_feed(user):
    """Fan-out on read: merge 150 newest-first lists, keep the top 20."""
    heap = []
    # 1. Put the NEWEST post of each followee on the heap.
    #    heapq is a min-heap, so store -timestamp to pop the newest first.
    for author in follows[user]:
        posts = timeline[author]
        if posts:
            ts, pid = posts[0]
            heap.append((-ts, author, 0))
    heapq.heapify(heap)                 # 150 items, O(150)

    feed = []
    # 2. Pop the newest, then push that author's next post. 20 times.
    while heap and len(feed) < FEED_SIZE:
        neg_ts, author, i = heapq.heappop(heap)
        feed.append(timeline[author][i])
        if i + 1 < len(timeline[author]):
            next_ts, _ = timeline[author][i + 1]
            heapq.heappush(heap, (-next_ts, author, i + 1))
    return feed


# Check against the slow, obvious answer: collect everything and sort.
everything = sorted((p for a in follows[0] for p in timeline[a]), reverse=True)
assert home_feed(0) == everything[:FEED_SIZE]

# The standard library can do the same merge in one line.
merged = heapq.merge(*(timeline[a] for a in follows[0]), reverse=True)
assert list(islice(merged, FEED_SIZE)) == everything[:FEED_SIZE]

print(home_feed(0)[:3])
Observe: it prints the three newest posts, and both asserts prove the heap equals the 3,000-post sort and heapq.merge.
Second, fan-out on write with the large-account threshold and the hybrid read. Save as fanout_write.py.
import heapq
from collections import defaultdict, deque
from itertools import islice

FEED_KEEP = 500        # ASSUMED: keep only the newest 500 post ids per feed
CELEBRITY = 100_000    # ASSUMED: at or above this many followers, skip fan-out

followers = defaultdict(set)    # author -> users who follow them
following = defaultdict(set)    # user -> authors they follow
feed = defaultdict(lambda: deque(maxlen=FEED_KEEP))  # user -> (ts, id), newest first
own_posts = defaultdict(list)   # author -> (ts, id), newest first


def follow(user, author):
    followers[author].add(user)
    following[user].add(author)


def publish(author, ts, post_id):
    """Fan-out on write: push the new post id into every follower's feed."""
    own_posts[author].insert(0, (ts, post_id))
    if len(followers[author]) >= CELEBRITY:
        return 0                        # celebrity: readers pull it later
    for user in followers[author]:
        feed[user].appendleft((ts, post_id))   # oldest falls off past 500
    return len(followers[author])       # how many writes this one post cost


def read_feed(user, n=20):
    """Hybrid read: the ready-made feed plus a small merge of celebrities."""
    celebs = [own_posts[a] for a in following[user]
              if len(followers[a]) >= CELEBRITY]
    merged = heapq.merge(feed[user], *celebs, reverse=True)
    return list(islice(merged, n))


for u in range(150):
    follow(u, "author_a")
print(publish("author_a", 1_700_000_000, "p1"))   # prints 150
print(read_feed(7))                               # [(1700000000, 'p1')]
Observe: publish returns 150, the write amplification of that post. Change CELEBRITY to 100 and it returns 0, yet read_feed(7) still shows the post, now through the read-time merge. In production the loop runs in a worker behind a queue partitioned by author, and timelines live in Redis.
Third, every number in the worked example, recomputed. Save as numbers.py; change an assumption and the whole chain updates.
import math
# ASSUMED inputs (teaching numbers, not any company's traffic)
DAU, LOADS, PEAK = 100_000_000, 10, 3
FOLLOWS, PAGE = 150, 20
POSTERS = 0.10            # 1 in 10 daily users posts once a day
CAP = 500                 # newest post ids kept per timeline
DAY = 24 * 60 * 60

reads_avg = DAU * LOADS / DAY
reads_peak = reads_avg * PEAK
posts_peak = DAU * POSTERS / DAY * PEAK
print(f"feed reads   avg {reads_avg:,.0f}/s  peak {reads_peak:,.0f}/s")
print(f"posts        peak {posts_peak:,.1f}/s")

# Fan-out on read: one list read per followed account per feed.
print(f"read model   {FOLLOWS * reads_peak:,.0f} list reads/s (rounded peak 35,000: {FOLLOWS*35_000:,})")
# Fan-out on write: average followers = average follows (each edge has two ends).
print(f"write model  {posts_peak * FOLLOWS:,.0f} timeline inserts/s + {reads_peak:,.0f} range reads/s")
print(f"reads per post  {reads_peak / posts_peak:,.0f}")

# Merge cost for the top PAGE of k lists: heapify k, then PAGE pops and pushes.
k = FOLLOWS
print(f"log2(150) = {math.log2(k):.2f};  ~{k} + 2*{PAGE}*{math.log2(k):.1f} = {k + 2*PAGE*math.log2(k):.0f} heap steps vs sorting {k*20:,} posts")

# One post from a 50M-follower account at the platform's peak insert rate.
big = 50_000_000
print(f"50M inserts at {posts_peak*FOLLOWS:,.0f}/s = {big/(posts_peak*FOLLOWS):,.0f} s")

# Timeline memory, three ways (bytes per entry are ASSUMED).
for name, entries, b in [("raw ids, 500", CAP, 8), ("id+score, 500", CAP, 16),
                         ("skiplist ~80 B, 500", CAP, 80), ("listpack ~20 B, 128", 128, 20)]:
    print(f"memory {name:22s} {DAU*entries*b/1e9:,.0f} GB")

# Hot key: a 50M-follower account read at request time.
hot = big * LOADS / DAY * PEAK
print(f"hot key reads at peak {hot:,.0f}/s; with 1 s local cache on 200 servers: 200/s")

# Tail amplification: one feed waits for all 150 list reads.
p_slow = 1 - 0.99 ** FOLLOWS
print(f"P(at least one of 150 reads beyond its p99) = {p_slow:.1%}")

# Measured (labs/sd-3, M2 Pro, Node 22.13.1, one core, in memory).
measured, guess = 73_526, 10_000
S = 1e6 / measured
print(f"measured {measured:,}/s = {S:.1f} us per feed; guess off by {measured/guess:.2f}x")
print(f"merge cores at peak, 100% busy: {reads_peak/measured:.2f}; at 50%: {reads_peak/(measured*0.5):.2f}; guess at 50%: {reads_peak/(guess*0.5):.2f}")
for rho in (0.5, 0.8, 0.9):
    print(f"M/M/1 rho={rho}: response {S/(1-rho):.1f} us")
Observe: it prints every figure in the worked example. The measured rate is an input, not measured by this script.
Failure modes and edge cases
- Fan-out backlog. Workers fall behind. Alert on queue lag (age of the oldest unprocessed post), not length; separate queues by author size, add workers or lower the threshold.
- Cold or evicted timelines. A missing key on read: pull-merge for that request and write the result back.
- Timeline store loss. Timelines are derived, so rebuild them; plan that throughput, because a lost shard sends all its users to pull at once.
- Out-of-order inserts. Retries arrive late. Scoring by creation time keeps order, and ZADD of an existing member only updates its score, so retries are idempotent.
- Threshold crossing. Older posts sit in timelines, newer ones are pulled; both merge by score. Deduplicate by post id.
- Hot shard. Track per-key request rates; use the local cache or replicas.
- Deep scroll. Past the cap of 500, pull-merge backwards from the cursor: slow, but rare.
Trade-offs
| Option | Good for | Costs you | Use when |
|---|---|---|---|
| Fan-out on read | No stored timelines; follows, unfollows and deletes are correct at once | F list reads per feed (5,250,000/s here); feed p99 set by the slowest of F reads | Small scale, or reads close to writes |
| Fan-out on write | One range read per feed; p99 of one read | Write amplification = followers; timeline memory (256 GB to 4 TB here, assumed overheads); stale entries to filter | Reads far exceed writes and no author has a huge following |
| Hybrid | Fast reads and bounded fan-out bursts | Two paths, a threshold to tune, a small merge and a hot key per large author | A social graph with a few enormous accounts |
| Offset pagination | Simple, jump to page N | Linear cost in depth; duplicates when the head grows | Static, small result sets |
| Cursor pagination | Constant cost per page; stable while new items arrive | No random page access; cursor needs a tie-breaker | Any feed or infinite scroll |
Common mistakes
In an interview
- Clarify. Time order or ranked, page size, freshness, scope.
- Assumptions. Derive about 35,000 reads and 347 posts a second, a ratio of 100.
- Structure. API with a cursor, data model, read and write paths.
- Deep dive. Pull vs push costs and the crossover, the hybrid, sorted sets with a cap.
- Trade-offs. Memory vs read cost, freshness vs availability, hot keys, tail latency.
- Wrap up. Measure storage p99, queue lag and memory per timeline first.
"Scope: post, follow, a time-ordered feed of 20, p99 under 200 ms, seconds of staleness allowed. At 100 million daily users, 10 loads each and a 3× peak, that is about 35,000 reads a second against about 347 posts, a ratio of 100. Pull costs 150 list reads per feed, 5.25 million a second, and inherits the slowest of 150 reads. So I push each post id into followers' Redis sorted sets, capped with ZREMRANGEBYRANK, about 52,000 inserts a second; a read is one ZRANGE plus a hydrating multi-get. Accounts over about 100,000 followers are pulled at read time behind a short local cache, since one 50-million-follower post is 16 minutes of fan-out. Cursors are (time, id); deletes and unfollows are filtered at read. Then I measure storage p99 and queue lag."
Practice
BeginnerConvert 1,000,000,000 feed loads a day into a peak rate with a 3× peak factor.
1,000,000,000 ÷ 86,400 ≈ 11,574 a second on average; × 3 ≈ 34,722, about 35,000 a second.
IntermediateWhat is the cost of producing the top n posts from k sorted lists with a heap, and why not sort?
O(k + n log k): build a heap of k heads, then n pops and pushes. Sorting all N candidates is O(N log N), mostly for posts never shown.
IntermediateWhy does offset pagination show duplicates on a live feed?
New posts arrive at the head, so every item shifts down. If 3 posts arrive between page 1 and page 2, offset 20 starts 3 items earlier and repeats them.
AdvancedPer author, follower count cancels out of the push vs pull operation count. Why use a threshold at all?
Because the work arrives as a burst: 50,000,000 inserts for one post is about 960 seconds of peak fan-out capacity, delaying that post and everyone queued behind it.
AdvancedEach list read has a 1% chance of exceeding its p99. What fraction of pulled feeds over 150 lists see at least one slow read?
1 − 0.99¹⁵⁰ ≈ 77.9%. The component's tail becomes the feed's typical case; push reduces the read to one lookup.
AdvancedWhy is 500 entries per timeline a worse memory choice in Redis than 128, beyond the 3.9× entry count?
Above zset-max-listpack-entries (128 by default) the set converts from a compact listpack to a skip list plus hash table with several times the per-entry overhead: 256 GB becomes 4 TB here, under assumed overheads.
AdvancedThe merge ran at 73,526 feeds a second on one core. How many cores does the feed service need?
Unknown from this run. For the merge alone, 34,722 ÷ (73,526 × 0.5) ≈ 0.94 cores at 50% utilisation. Network and storage were not measured.
Cheat sheet
| Term or formula | One-line meaning |
|---|---|
| Design process | Requirements, estimates, API, data model, high-level, deep dive, measure |
| Read to write ratio R ÷ W | Push wins when it exceeds c_ins ÷ c_list (about 100 here) |
| K-way merge | O(N log k) for all items; O(k + n log k) for the top n |
| Write amplification | Writes caused by one post = follower count |
| ZADD | O(log N) insert or score update; idempotent per member |
| ZRANGE … REV / BYSCORE | O(log N + M) newest-first range; replaces ZREVRANGE |
| ZREMRANGEBYRANK key 0 -501 | Keep only the 500 highest scores |
| Score precision | Double, exact to 2⁵³; score by ms time, not by 64-bit id |
| Cursor | (score, id) of the last item; constant cost, no duplicates |
| Hot key | One key read by many; local cache with a short TTL or replicas |
| M/M/1 response time | S ÷ (1 − ρ); plan near 50% utilisation |
| Tail amplification | 1 − (1 − p)^k chance a fan-out of k waits on a slow part |
Further reading
- Python heapq documentation: heap operations and
heapq.merge. - Designing Data-Intensive Applications: derived data and the timeline load example.
- Timelines at Scale (InfoQ): a public talk on push timelines and large accounts.
- Redis sorted sets: the type, its implementation and commands.
- PostgreSQL LIMIT and OFFSET: why skipped rows still cost work.
- The Tail at Scale: tail amplification and hedged requests.
This is a typical, simplified design used to teach general patterns. It is not a description of Instagram's or any other company's private systems. All traffic numbers and per-entry memory overheads are assumptions; the one measured figure comes from an in-memory benchmark of the merge on one laptop core with synthetic data.
Frequently asked questions
What is system design?
Deciding a system's components, the interfaces between them and where data lives so it meets stated requirements at a stated load, then checking the cost model against measurements.
When is fan-out on write better than fan-out on read?
When reads per post exceed the cost of a timeline insert relative to a list read. With about 100 reads per post, push does roughly 60 times fewer storage operations than pull in this example.
Why do large accounts need special handling?
One post from a 50,000,000-follower account is 50,000,000 inserts at once, about 960 seconds of the assumed peak fan-out capacity. Pulling those accounts at read time spreads the cost and their lists cache well.
Why use cursor pagination for a feed?
Offset pagination costs more the deeper you scroll and repeats items when new posts arrive at the head. A cursor of (time, id) costs the same on every page and does not shift.
How much memory do stored timelines need?
It depends on the cap and the encoding. Under assumed per-entry overheads, 100 million timelines range from about 256 GB (128 entries, compact listpack) to about 4 TB (500 entries, skip list). Measure with MEMORY USAGE.
Is this how Instagram really works?
Not necessarily. It is a typical design used to teach the mechanisms. Instagram's private systems are not described here.
Sources
- Python documentation: heapq, heap queue algorithmdocs.python.org
- Designing Data-Intensive Applications (book site)dataintensive.net
- Timelines at Scale (QCon San Francisco talk on InfoQ)infoq.com
- Redis documentation: sorted setsredis.io
- PostgreSQL documentation: LIMIT and OFFSETpostgresql.org
- The Tail at Scale (Google Research publication)research.google
Linked from
- 50K fans, 5K seats. Design it.Part 1 · Performance vs scalability
- Two fans click the same seat at the same moment. Who wins?Part 2 · Race conditions and strong consistency
- 1M rides a day. What do you do in the first 5 minutes?Part 4 · Requirements in depth
- A highway with 10 lanes can still be slowPart 6 · Latency vs throughput, measured
- Context window: why a long AI chat forgets your name

Written by a software engineer and system architect with 10+ years of building production web, payment, ticketing and accounting systems in Japan and Nepal. About us